Figure 2.

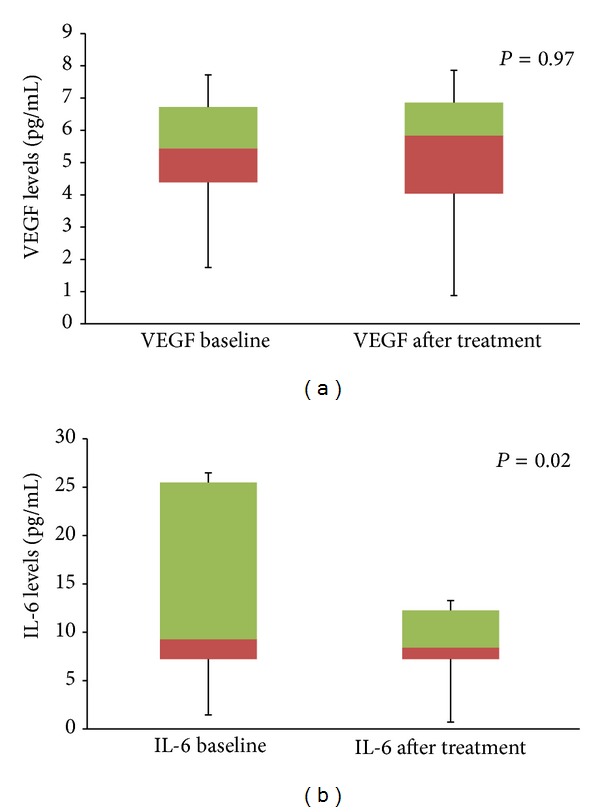
Box plot diagram showing the change in mean aqueous VEGF levels (a) and change in mean aqueous IL-6 levels (b) in patients in group 1. The error bar represents standard deviation.

Box plot diagram showing the change in mean aqueous VEGF levels (a) and change in mean aqueous IL-6 levels (b) in patients in group 1. The error bar represents standard deviation.