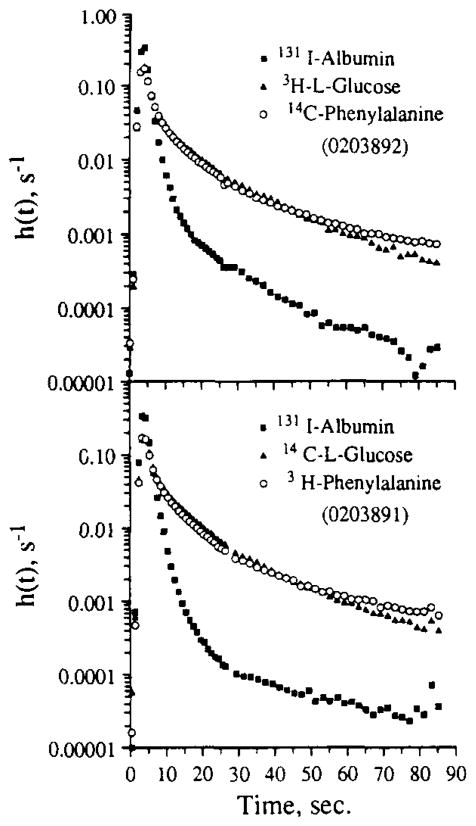
FIG. 8.
Two sets of outflow dilution curves obtained from rabbit heart in response to the simultaneous injection (0.4 ml bolus) of the tracers into the aortic root. The ordinate, h(t), is the fraction of the injected tracer dose emerging per second into the outflow. The samples were analyzed using the gel system. The difference in the shape of the phenylalanine curves from the L-glucose curves gives a measure of uptake by myocytes. Note that the subtle differences between L-glucose and phenylalanine are the same in the two sets of curves even though their tracer labels 3H and 14C were interchanged. Note also that the albumin curve has a 104 range of values and that the ratio of 131I/14C ranges from about 2 to 3 on the upslopes and peaks to about 0.03 during the tail of the curves.

