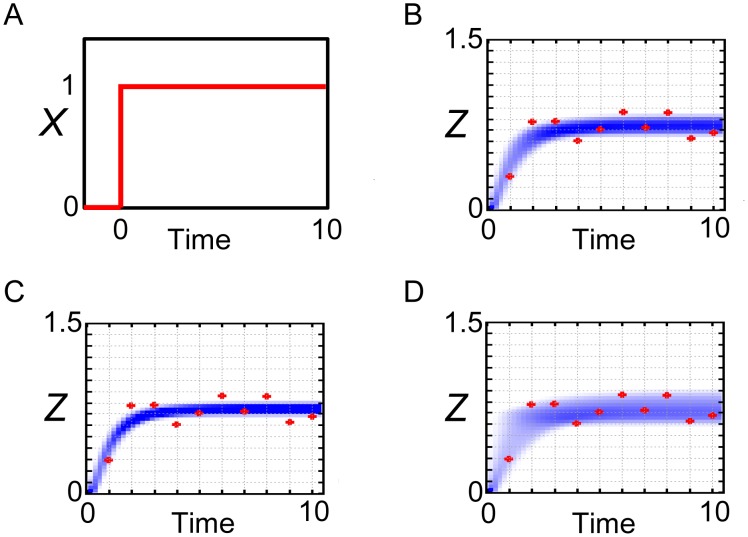
Figure 3. Reproduction of the observed data by the coherent FFL model.
Simulations with the posterior parameter ensemble of the coherent FFL model in response to the step stimulation of X. (A) Input step stimulation of X. (B) Annealing schedule: (ε0, ε1, ε2, ε3, ε4, ε5) = (∞, 1, 0.5, 0.25, 0.2, 0.15). (C) Annealing schedule: (ε0, ε1, ε2, ε3, ε4, ε5) = (∞, 1, 0.5, 0.25, 0.15, 0.11). (D) Annealing schedule: (ε0, ε1, ε2, ε3, ε4, ε5) = (∞, 2, 1, 0.75, 0.5, 0.25). Blue-colored area is the probability density consists of the simulated trajectories. Red points are the observed data.

