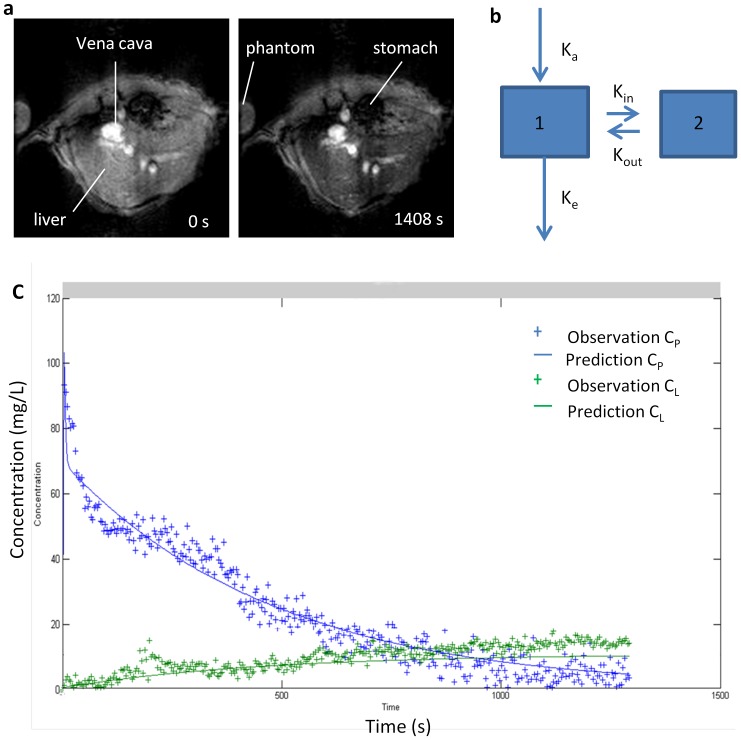
Figure 1.
a. Transversal T2* MR images of liver before (left) and 20 min (right) after intravenous injection of SPIO-NP in the concentration of 10 mg Fe/kg. The negative contrast indicates the accumulation of SPIO-NP in liver. b. Schematic of the two compartment model used to describe the data. Compartment 1 and 2 are blood and liver, respectively. The model is entirely determined by the values of the four constants, Ka (s−1), Ke (s−1), Kin (s−1), and kout (s−1). c. Simultaneous pharmacokinetic fitting of SPIO nanoparticle in the blood and liver. Individual measurements (crosses) and the determined fit (solid line) are shown.

