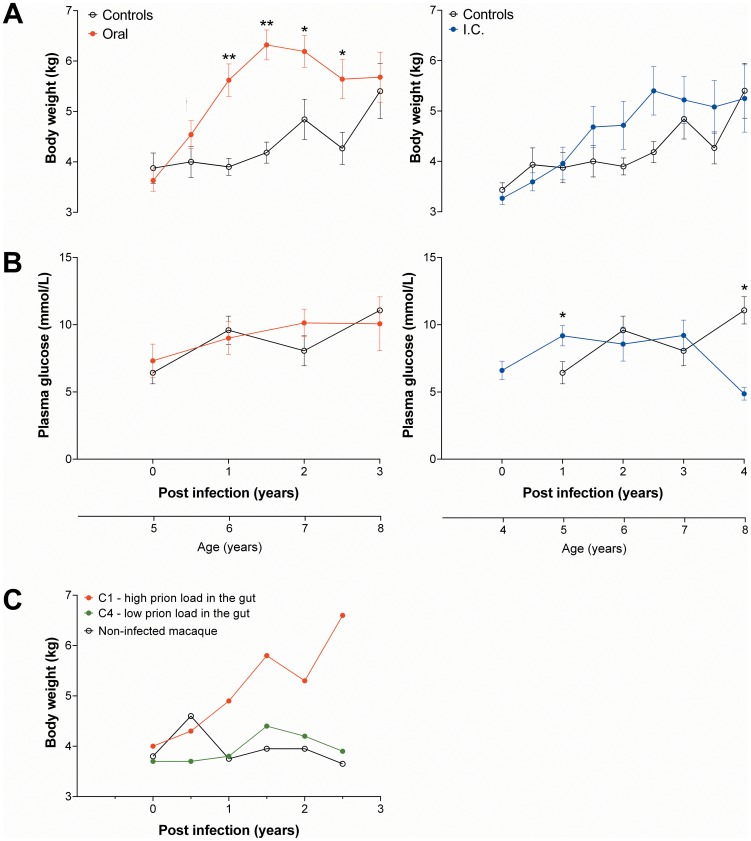
Figure 1. Longitudinal changes of body weight (A and C) and plasma glucose concentration (B) after BSE infection.
Depicted are the body weights (A) and plasma glucose (B) of orally (n = 5, group B) and i.c. (n = 6, group A) infected animals compared with MOCK controls (n = 5–6, group K). The same MOCK group was used for comparisons with the oral and i.c. group. (C) Individual longitudinal body weights of two orally BSE-infected macaques of group C (C1 and C4) and a MOCK control animal. * - p<0.05, ** - p<0.001 († - p<0.05, compared to baseline of the orally-infected group; Wilcoxon signed-rank test).

