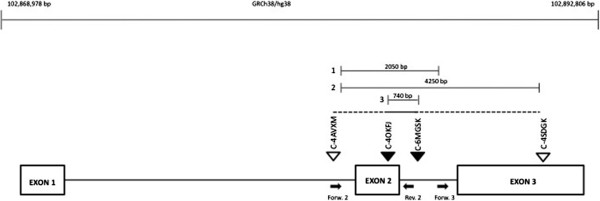
Figure 3.

Schematic representation of CISD2 gene and of the deleted region. Black arrows represent PCR primers, unfilled triangles undeleted probes while filled triangles deleted probes. Line 1 represent the size of the deletion obtained by combining array and PCR data, line 2 and line 3 respectively the maximum size of the deletion and the minimum size of the deletion based on array results. On the upper line the coordinates of the region in hg38.
