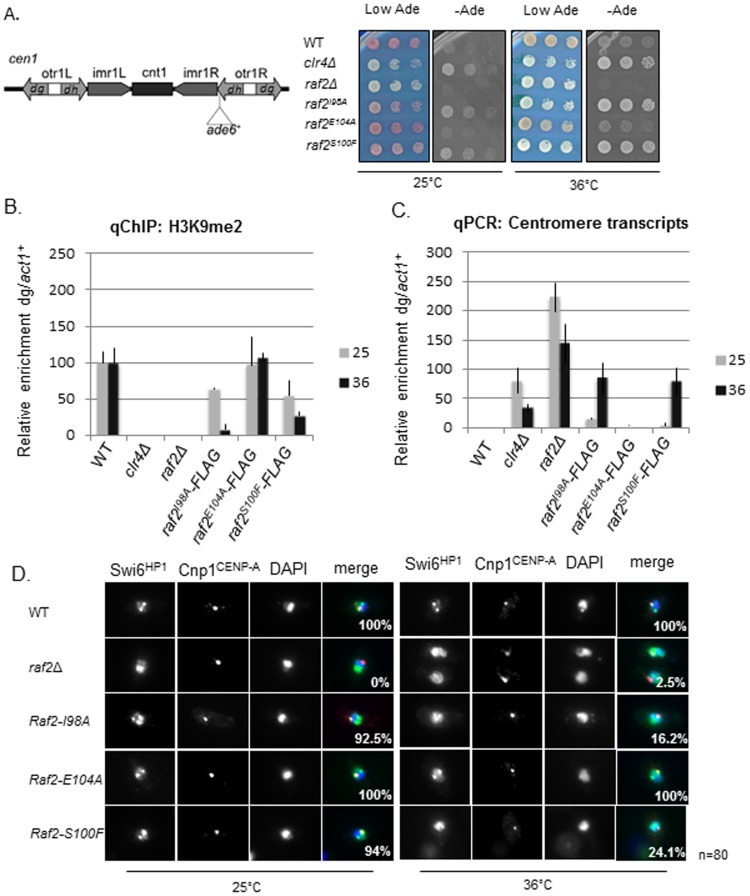
Figure 2. RFTS mutants conditionally disrupt heterochromatin integrity.
A. Assay for silencing at cen1:ade6+. Diagram shows the position of the cen1:ade6+ marker gene within centromere 1, relative to the outer repeat (otr) dg and dh elements, innermost repeats (imr), and central core (cnt). Wild-type cells with the marker gene repressed form red colonies on low adenine whereas cells with disrupted heterochromatin such as clr4Δ or raf2Δ cause marker gene expression and form white colonies. Raf2-I98A and raf2-S100F disrupt marker gene silencing specifically at 36°C but not at 25°C. B. ChIP analysis of H3K9me2 levels associated with cen(dg) relative to act1+ in clr4Δ and raf2 mutant cells normalised to wild-type at 25°C or 36°C. Error bars: SEM. C. qRT-PCR analysis of cen(dg) transcript levels relative to a control transcript act1+, normalised to wild-type at 25°C or 36°C. Error bars: SEM. D. Swi6 localisation in wild-type or mutant cells at 25°C or 36°C. Representative images of fixed cells with Swi6 (green), CENP-ACnp1(red) and DNA (DAPI-blue). Numbers shown denote % cells with Swi6 localised at centromeres, as determined by colocalisation with Cnp1, from a total number of 80 cells per sample.

