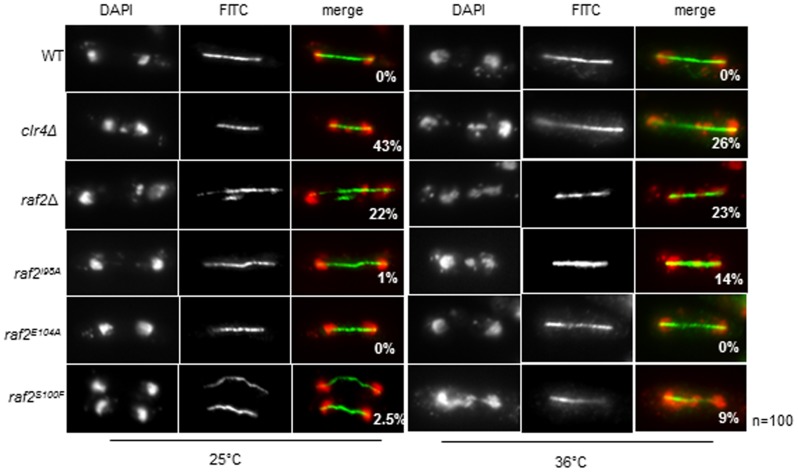
Figure 3. Raf2 conditional mutants display defective chromosome segregation at the restrictive temperature.
Analysis of lagging chromosomes in anaphase by fluorescence microscopy. Cells with defective heterochromatin display lagging chromosomes in anaphase. Shown here are representative images of fixed cells stained with DAPI (red) and tubulin (green). The numbers shown denote % anaphase cells with lagging chromosomes. 100 mitotic cells were counted for each sample.

