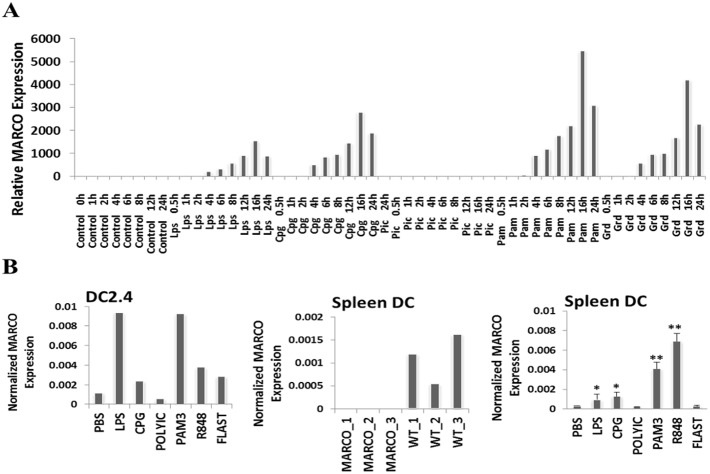
Figure 1. Expression of MARCO receptor in splenic and bone marrow-derived DC.
(A) MARCO gene expression was determined in BMDC at various time points following treatment with various TLR agonists. Raw data from gene expression dataset GSE17721 [20] were analyzed to extract MARCO expression values. Data were processed for normalization using the RMAexpress tool and gene annotation using the MeV software. (B) MARCO expression as determined by RT-PCR is shown in TLR agonist-activated DC2.4 cell line (left panel), splenic DC from WT and MARCO−/− DC from 3 individual mice (middle panel), and TLR agonist-activated splenic DC (right panel). GAPDH expression was used for normalization. Data shown as Mean ± SD from triplicates. *P<.05; **P<.01.

