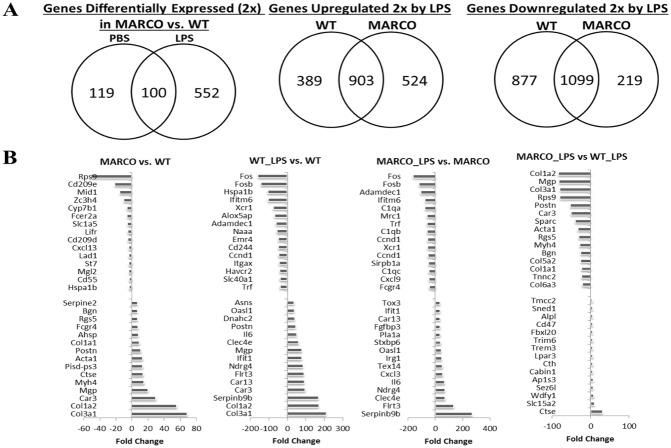
Figure 2. Differentially expressed genes in WT and MARCO−/− DC cells.
High purity DC preparations were isolated from splenocytes from 5–6 mice per group by positive selection with CD11c antibody and incubated overnight in media containing PBS or LPS (100 ng/ml). Total RNA was extracted and subjected to gene expression profiling. (A) Venn diagrams showing the numbers of genes that differ in expression by a factor of at least 2 between WT and MARCO−/− DC without and with LPS (left diagram), and numbers of genes that are differentially upregulated (middle diagram) or downregulated (right diagram) in WT and MARCO−/− DC following LPS exposure. (B) Top 15 differentially expressed genes that characterize MARCO vs. WT, WT_LPS vs. WT, MARCO_LPS vs. MARCO, and MARCO_LPS vs. WT_LPS. Data shown represent fold change of gene expression.

