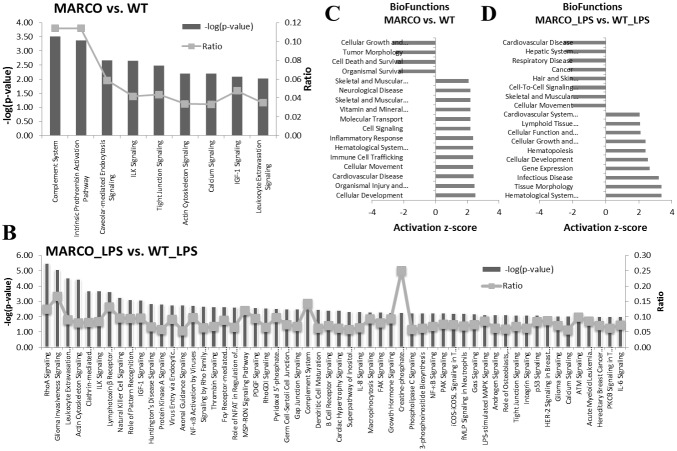
Figure 3. Major DC Signaling Pathways and Functions are affected by MARCO.
Sets of differentially expressed genes (fold change of 2 or higher) between different DC conditions were uploaded onto Ingenuity Pathway Analysis and corresponding signaling pathways were predicted. (A) MARCO vs. WT. (B) MARCO_LPS vs. WT_LPS. Statistical significance was set at −log P = 2 (Left Y Axis). The Ratio on the right Y axis represents the fraction of genes that are differentially expressed in our dataset that fall within a specific pathway out of the total number of genes that contribute to that pathway. Similarly, Biofunction analysis was performed for MARCO vs. WT (C) and MARCO_LPS vs. WT_LPS (D). Statistical significance was set at activation z-score = 2. Scores higher than 2 indicate activated functions, whereas scores lower than −2 indicate inhibited functions.

