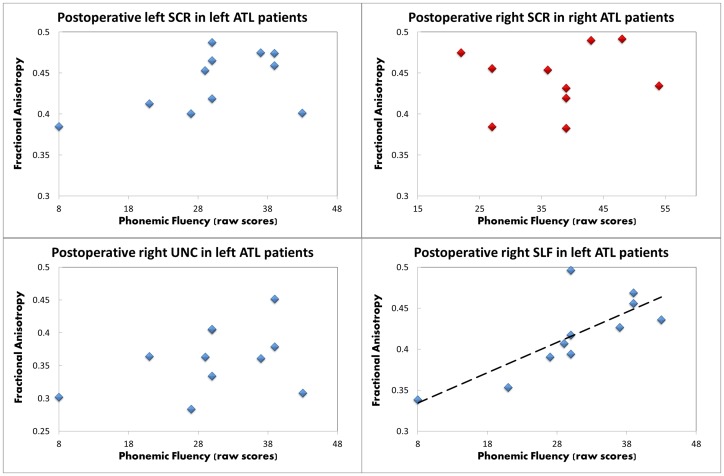
Figure 5. Postoperative relationship between phonemic fluency and FA values.
The four clusters that increased FA in the two groups are shown in the four panels (blue = LATL group; red = RATL group). The regression line is placed for the significant correlation found in the right superior longitudinal fasciculus.

