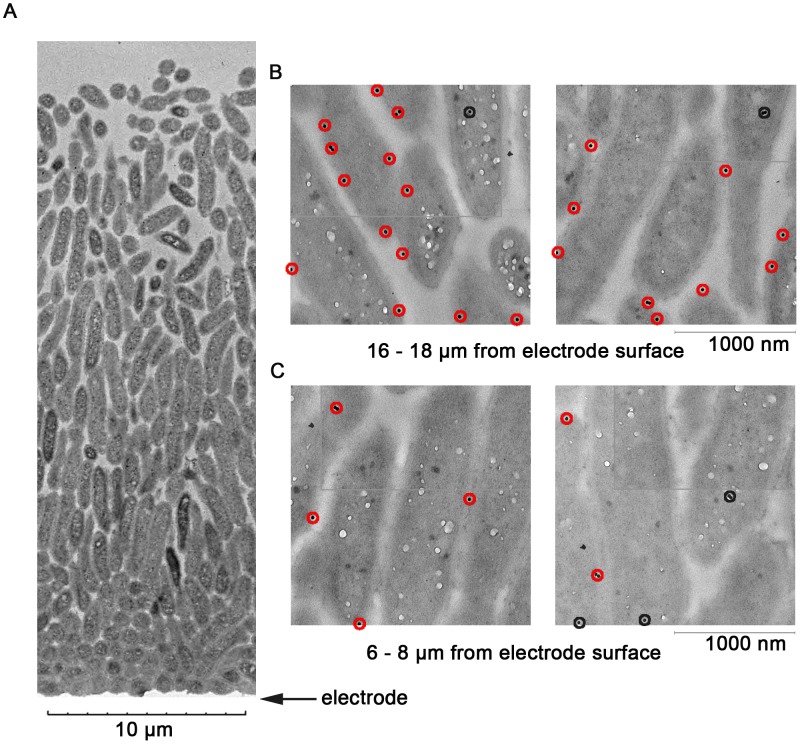
Figure 2. Representative biofilm and labeling with anti-OmcB antibody.
(A) Low-resolution Transmission Electron Microscopy image showing an entire unlabeled G. sulfurreducens biofilm, illustrating increase in cell density near the electrode surface. (B) Examples from digitally reconstructed high-resolution images representing cells 16–18 µm from the electrode labeled with anti-OmcB antibodies. Red circles indicate proteins within 15 nm of the membrane, black circles indicate intracellular localization. (C) Examples of cells located 6–8 µm from the electrode, taken from the same biofilm reconstructions, with lower abundance of OmcB.

