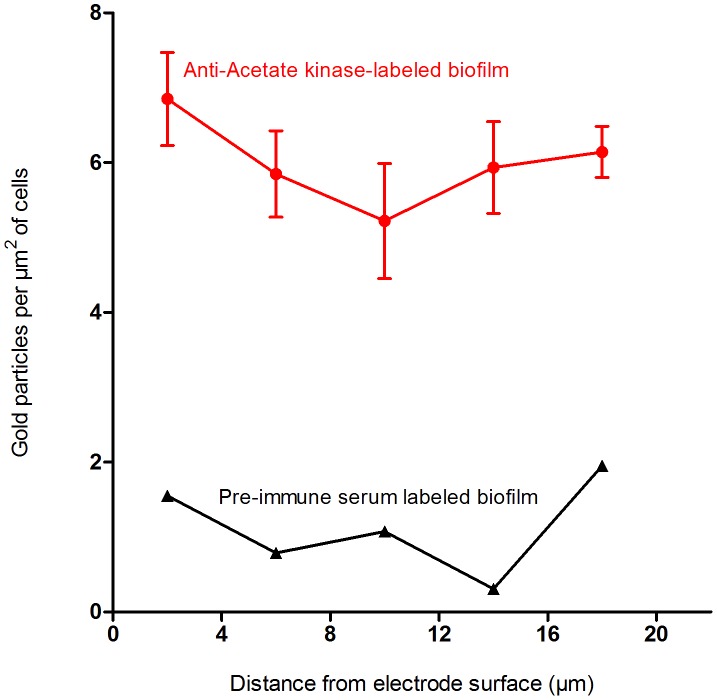
Figure 5. Abundance of acetate kinase isozymes at different distances from the electrode.
Means shown are the result of six different images, +/− SEM. Data from labeling after incubation with anti-acetate kinase antibodies (red circles) vs. labeling with pre-immune serum as a control (black triangles).

