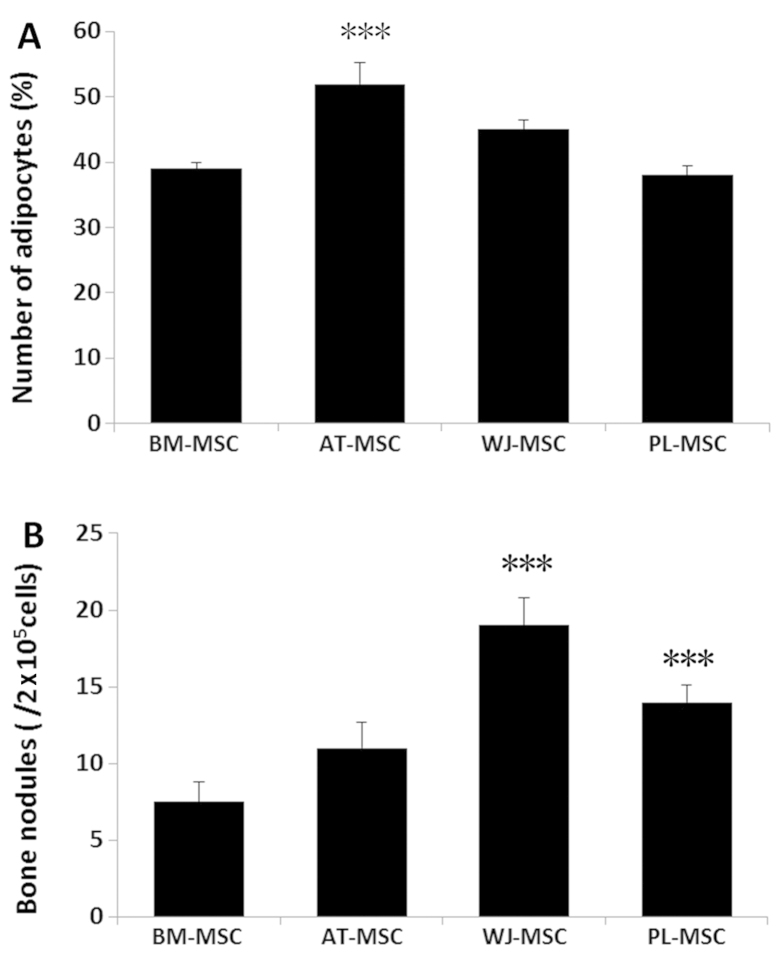
Figure 5.
Counting of differentiated adipocytes and bone nodules. Fifteen fields of differentiated adopocytes under a microscope and 9 wells of osteocytes were selected randomly from 3 samples in triplicate. The average of 3 is shown. (A) Adipocyte counting. Stained adipocytes were counted at a magnification of x400. There are 39±1% adipocytes per field from the BM-MSC induction, 52±3.2% from the AT-MSC, 45±1.5% from the WJ-MSC and 38±1.4% from the PL-MSC induction medium. (B) Bone nodule counting. Stained bone nodules were counted at a magnification of x100 in each well of a 12-well plate. A total of 7.5±1.3 bone nodules was counted from the BM-MSC, 11±1.7 from the AT-MSC, 19±1.8 from the WJ-MSC and 14±1.1 from the PL-MSC induction medium. ***P<0.001 when compared with BM-MSCs. BM, bone marrow; AT, adipose tissue; WJ, umbilical cord Wharton’s jelly; PL, placenta.

