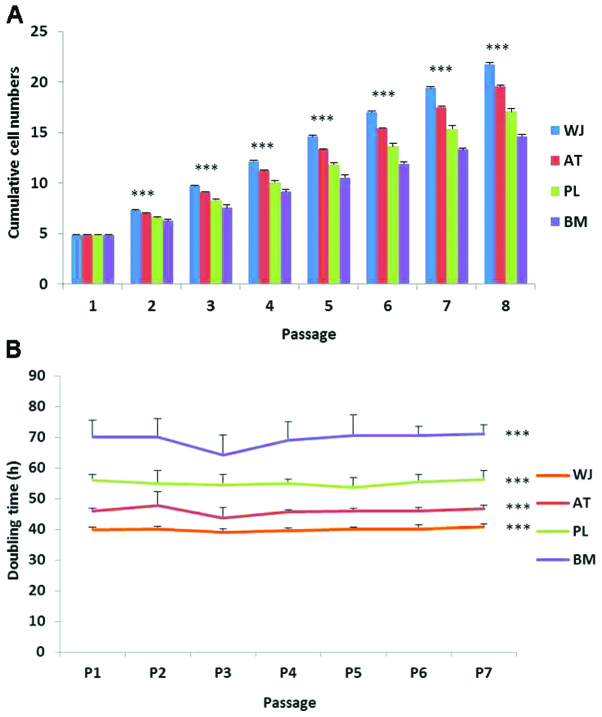
Figure 6.
Proliferative potential of mesenchymal stem cells (MSCs). The number of MSCs was counted each time following subculture from 1 to 8 passages. (A) The data are shown as cumulative cell numbers at each passage. Each column represents the mean from 3 MSC populations with standard deviation. (B) The population doubling time was also calculated based on cell counts. ***P<0.001 when compared to BM-MSCs. BM, bone marrow; AT, adipose tissue; WJ, umbilical cord Wharton’s jelly; PL, placenta.

