
Figure 7.
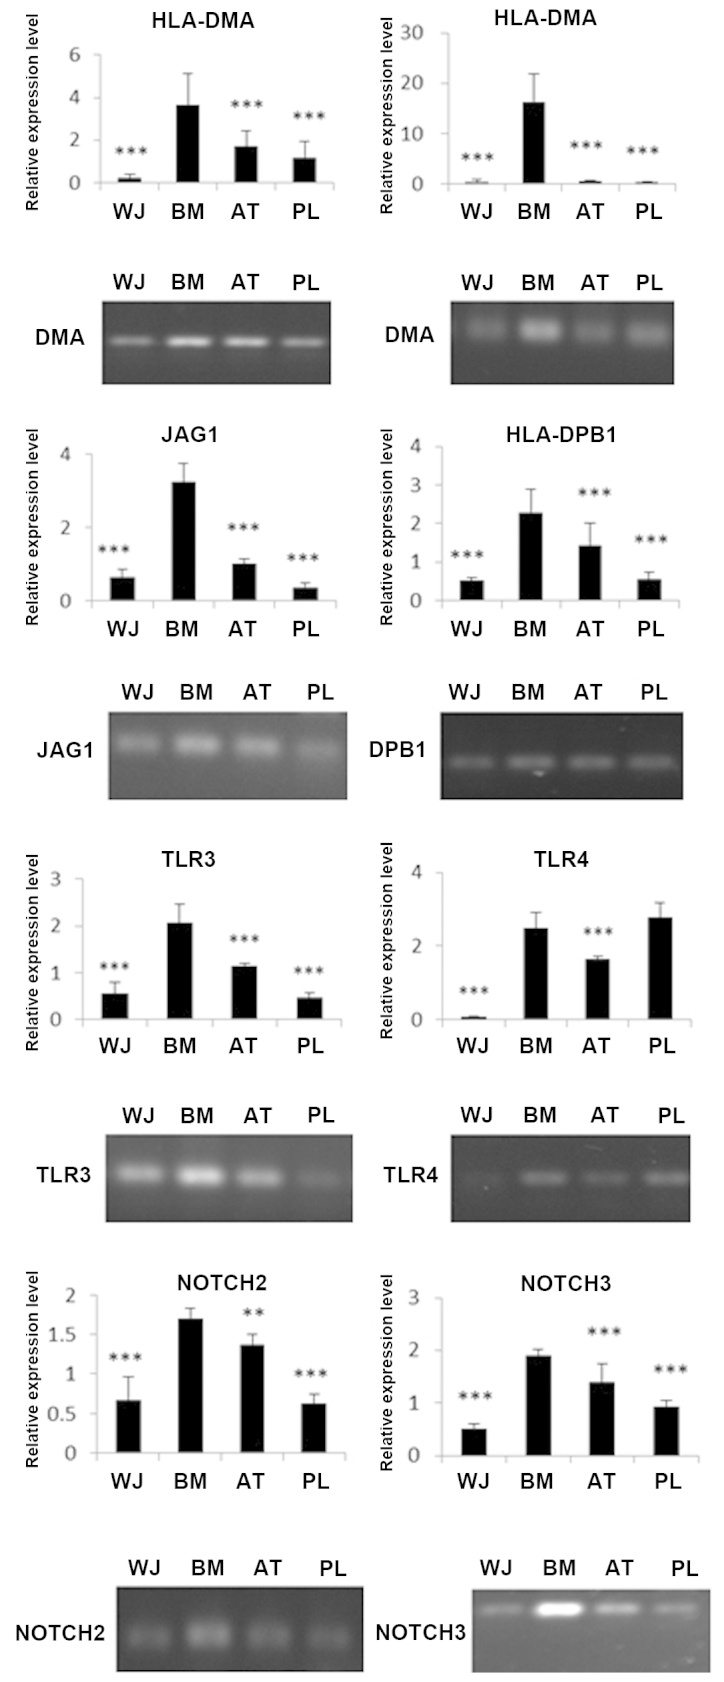
Expression of immune-related genes analyzed by RT-PCR and RT-qPCR. The mRNA level of immune-related genes from the WJ-, AT-, PL- and BM-MSCs was measured by RT-PCR and RT-qPCR. The column charts represent the RT-qPCR data and gel images below the charts represent the RT-PCR data. The data are presented as the means ± SD from 5 independent experiments. **P<0.01 and ***P<0.001 when compared to BM-MSCs. BM, bone marrow; AT, adipose tissue; WJ, umbilical cord Wharton’s jelly; PL, placenta.