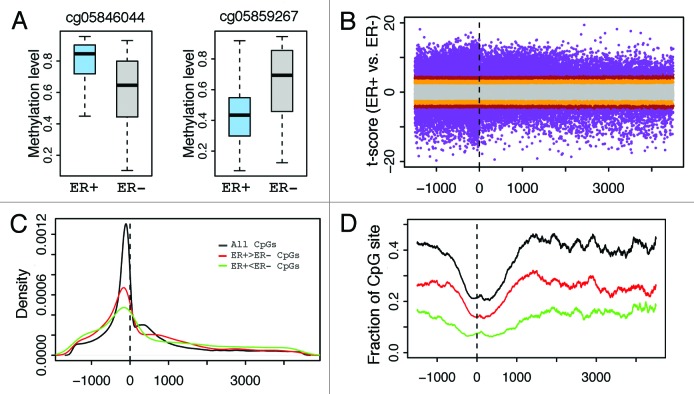
Figure 3. Distribution of CpGs with differential methylation levels between ER+ and ER- breast samples. (A) Examples- CpG may have higher methylation in ER+ (cg05846044) or ER- (cg05859267). (B) Relationship between differential methylation and CpG position relative to transcription start site (from –1500 upstream to 4500 downstream of TSS). (C) Distribution of CpGs with significant (P < 1e-6) differential methylation between ER+ and ER- samples. (D) Fraction of CpGs with significant differential methylation levels at different positions. The fraction is the ratio of the number of significant CpGs to the total number of CpGs in a DNA window. CpGs with significantly higher methylation levels in ER+ (red) and in ER- (green) samples are examined separately. The relative frequency of significantly differentially methylated CpGs increases as the distance from TSS increases.

An official website of the United States government
Here's how you know
Official websites use .gov
A
.gov website belongs to an official
government organization in the United States.
Secure .gov websites use HTTPS
A lock (
) or https:// means you've safely
connected to the .gov website. Share sensitive
information only on official, secure websites.
