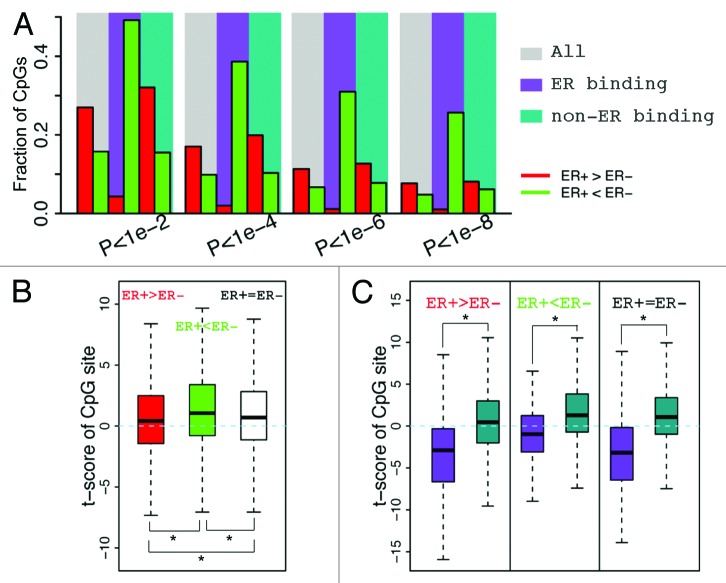
Figure 4. CpGs in ER binding sites tend to have lower methylation levels in ER+ breast samples. (A) The fraction of CpGs with significant differential methylation levels between ER+ and ER- samples. Note that CpGs in ER binding regions tend to have higher methylation levels in ER- samples, while CpGs not in ER binding regions tend to have higher methylation levels in ER+ samples. Four different thresholds are used to determine differential methylated CpGs. (B) Distribution of t-scores (ER+ vs. ER-) of methylation levels for CpGs. Genes are divided into 3 classes based on their expression levels in ER+ vs. ER- samples: ER+ > ER- (red), ER+ < ER- (green), and ER+ = ER- (white). Distributions of CpGs associated with the three gene classes are shown separately. (C) CpGs in ER binding regions tend to have lower methylation levels in ER+ samples (lower t-scores) compared with thosenot in ER binding regions, which is the case for CpGs associated with all three gene classes.

An official website of the United States government
Here's how you know
Official websites use .gov
A
.gov website belongs to an official
government organization in the United States.
Secure .gov websites use HTTPS
A lock (
) or https:// means you've safely
connected to the .gov website. Share sensitive
information only on official, secure websites.
