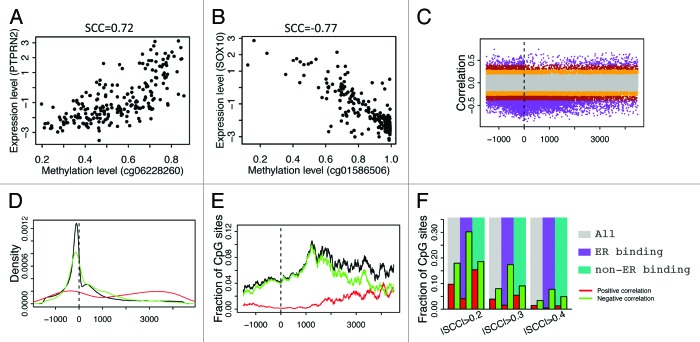
Figure 6. Correlation of CpG methylation level with expression level of the associated genes. (A) Methylation level of cg06228260 is positively correlated with its associated gene PTPRN2. (B) Methylation level of cg01586506 is negatively correlated with its associated gene SOX10. (C) Relationship between methylation-expression correlation and CpG position relative to transcription start site (from –1500 upstream to 4500 downstream of TSS). (D) Distribution of CpGs with strong correlations in methylation with expression level of the associated genes. Positive correlation (red, r > 0.4) and negative correlation (green, r < –0.4) are examined separately. (E) Fraction of CpGs strongly correlated with expression of the associated genes at different positions. (F) CpGs in ER binding regions tend to have negative correlation in their methylation with expression of their associated genes.

An official website of the United States government
Here's how you know
Official websites use .gov
A
.gov website belongs to an official
government organization in the United States.
Secure .gov websites use HTTPS
A lock (
) or https:// means you've safely
connected to the .gov website. Share sensitive
information only on official, secure websites.
