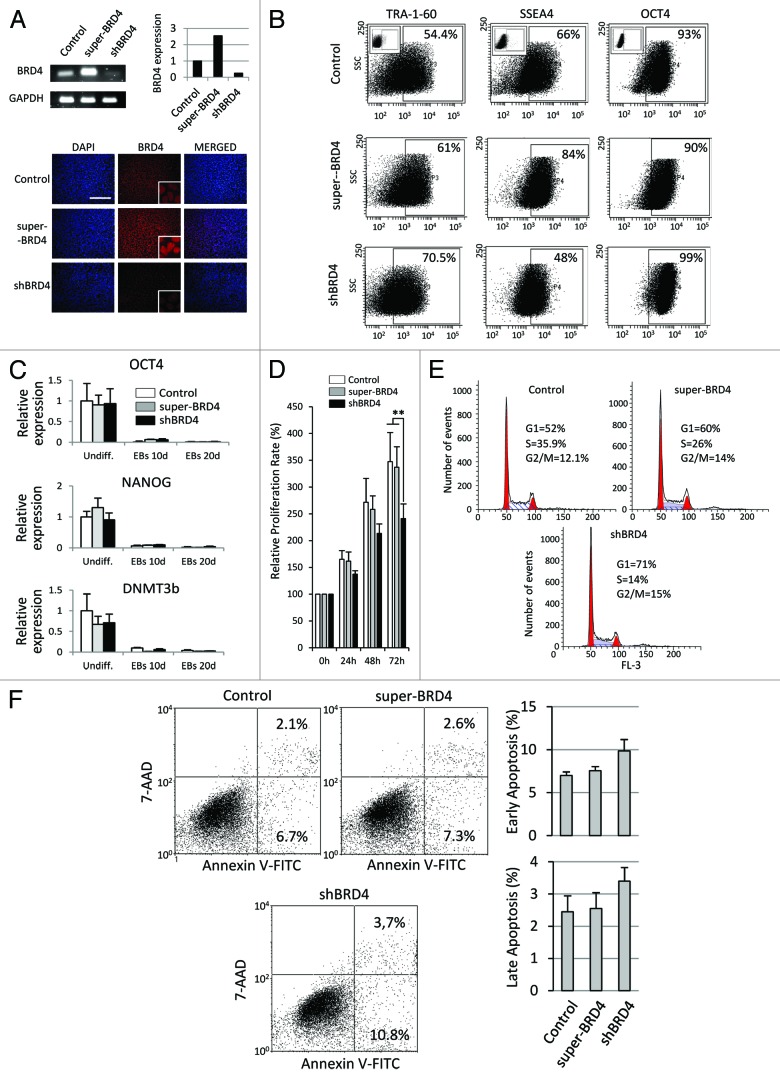
Figure 2. BRD4 alteration affected cell cycle progression but it did not induce spontaneous differentiation. (A) BRD4 mRNA levels analyzed by qRT-PCR and semi-quantitative PCR in shBRD4 and super-BRD4 ESCs. Lower panels show immunofluorescence staining for BRD4 (red). Nuclei were labeled with DAPI (blue). (B) Flow-cytometric analysis for OCT4, TRA-1–60, and SSEA4 in shBRD4 and super-BRD4 cells. (C) qRT-PCR analysis of OCT4, NANOG, and DNMT3b in undifferentiated ES cells, EBs at 10 and 20 d (control, shBRD4, and super-BRD4 cells). (D) Proliferation of shBRD4 and super-BRD4 cells compared with control cells, analyzed by MTT assay and represented as the mean value ± SD of three independent experiments (**P ≤ 0.01). (E) FACS analysis of DNA content in undifferentiated ESCs. (F) Apoptosis analysis by FITC-Annexin V staining. Left panels show representative dot plots. Graphs show mean values ± SD of three independent experiments.

An official website of the United States government
Here's how you know
Official websites use .gov
A
.gov website belongs to an official
government organization in the United States.
Secure .gov websites use HTTPS
A lock (
) or https:// means you've safely
connected to the .gov website. Share sensitive
information only on official, secure websites.
