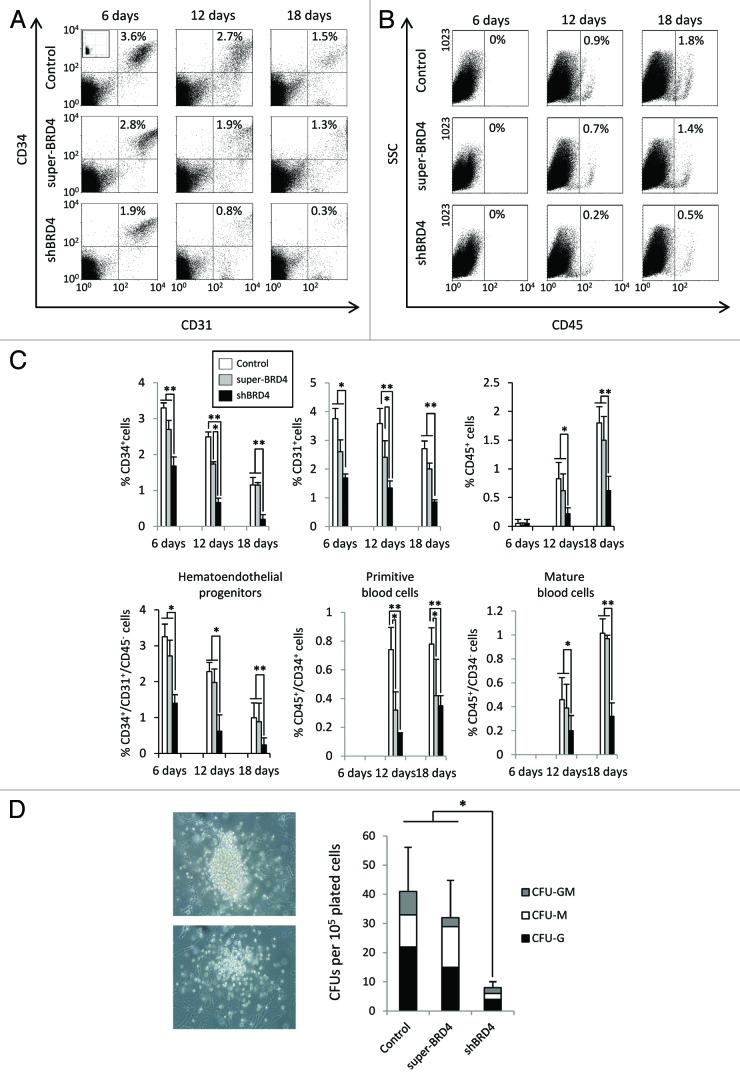
Figure 4. Downregulation of BRD4 impairs hematoendothelial specification. (A and B) Representative flow cytometry dot plots of hematopoietic markers during ESC differentiation on OP9 co-culture. The percentage of CD34+/CD31+ and CD45+ cells corresponding to each dot plot are shown in the upper right corner. (C) Percentage of CD34+, CD31+, and CD45+ cells during hematopoietic differentiation. Primitive hematoendothelial progenitors were identified as CD34+/CD31+/CD45-, immature blood cells as CD34+/CD45+ and mature blood cells as CD45+/CD34-. Percentages are represented as the mean value ± SD of three independent experiments. (D) Colony forming unit (CFU) potential of control, shBRD4, and super-BRD4 ESCs. Results are represented as the mean value ± SD of three independent experiments (*P ≤ 0.05) (**P ≤ 0.01).

An official website of the United States government
Here's how you know
Official websites use .gov
A
.gov website belongs to an official
government organization in the United States.
Secure .gov websites use HTTPS
A lock (
) or https:// means you've safely
connected to the .gov website. Share sensitive
information only on official, secure websites.
