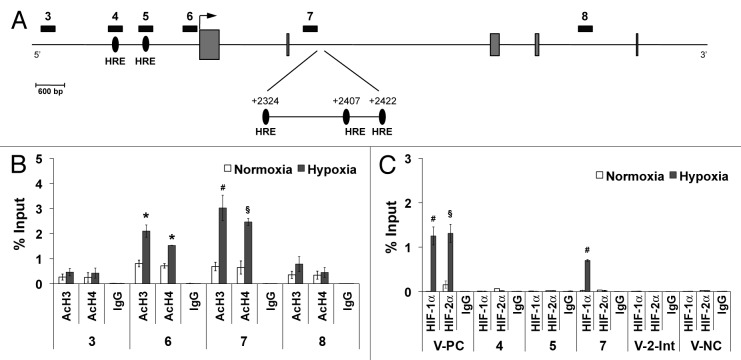
Figure 3. Histone acetylation enrichment and HIF-1α binding to human Plgf second intron. (A) Schematic representation of part of human Plgf gene. Regions analyzed by ChIP analysis are indicated by numerated black rectangles. Gray boxes represent exons. An arrow indicates the transcription start site. Black ovals indicate the putative HRE located in the promoter and in the second intron, identified by numbers indicating the central bases (G) of HRE core consensus sequence, with respect to the transcription start site. ChIP analysis for H3 (AcH3) and H4 (AcH4) acetylation (B) or for HIF-1α or HIF-2α (C), performed starting from chromatin sample from HUVEC exposed to hypoxia for 9 h. As control, species matched IgG were used. Data obtained by qRT-PCR are expressed as enrichment of chromatin-associated DNA fragments immunoprecipitated by specific antibody compared with input (% Input) and represent the mean ± SEM of two independent experiments performed in triplicate. *P < 0.05; §P < 0.01 and #P < 0.005 vs normoxic controls. Numbers indicate the amplified regions of Plgf gene, as reported in (A). V-PC and V-NC represent Vegf-a positive and negative controls, respectively, containing or not active HRE. V-2-Int, indicates Vegf-a second intron region containing a putative HRE.

An official website of the United States government
Here's how you know
Official websites use .gov
A
.gov website belongs to an official
government organization in the United States.
Secure .gov websites use HTTPS
A lock (
) or https:// means you've safely
connected to the .gov website. Share sensitive
information only on official, secure websites.
