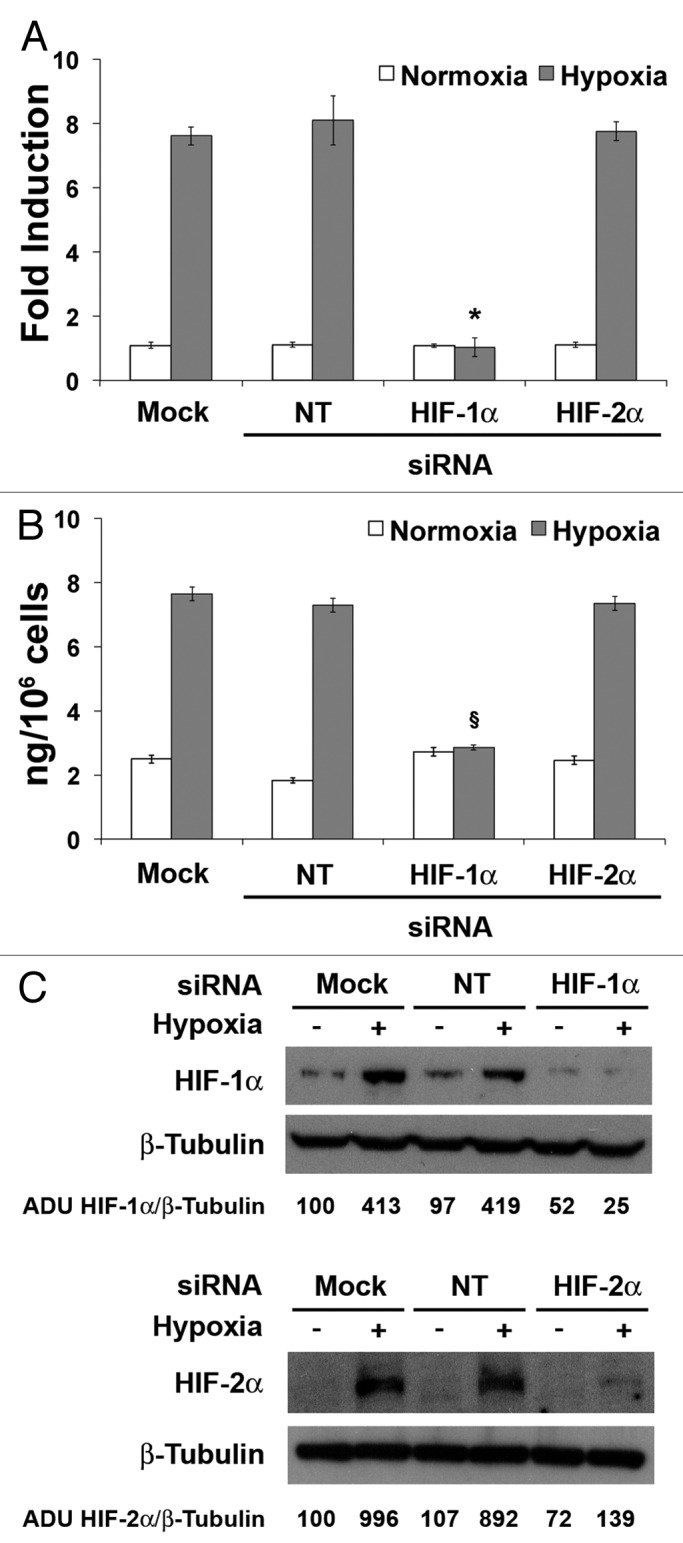
Figure 4. Knock down of HIF-1α, but not that of HIF-2α, inhibits hypoxia-induced human PlGF expression in HUVECs. (A) qRT-PCR analysis of human PlGF mRNA after silencing of HIF-1α or HIF-2α in HUVECs exposed to 1% O2 for 9 h and determination of PlGF concentration by sandwich ELISA (B) in HUVEC culture medium harvested after silencing of HIF-1α or HIF-2α and 24 h of exposure to 1% O2. As control, cells transfected with non-targeting (NT) siRNA and mock-transfected cells were used. Data obtained by qRT-PCR are expressed as fold induction and represent the mean ± SEM of two independent experiments performed in triplicate. Data obtained by ELISAs represent the mean ± SEM of two independent experiments performed in triplicate. *P < 0.0005 and §P < 0.001 vs controls and HIF-2α in hypoxia. (C) Western blot analysis of human HIF-1α (up) and HIF-2α (down) performed on HUVEC protein extracts, after cells exposure to 1% O2 for 24 h. β-Tubulin detection on the same filter was used for normalization. Densitometry analyses are reported as percentage of arbitrary densitometry units (ADU) of the ratio of HIF-1α or HIF-2α and β-Tubulin, assigning the value of 100 to the relative ratio obtained in mock-transfected cells in normoxic condition.
