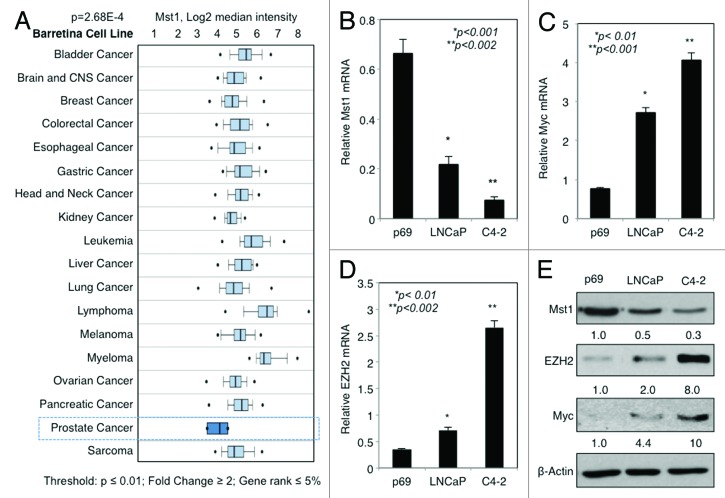
Figure 1. Expression of MST1 is inversely correlated with those of MYC and EZH2 in PC cells. (A) Analysis of Oncomine microarray data for MST1 mRNA expression changes in multiple cancer cell lines. (B–E) Analysis of MST1 (B), MYC (C) and EZH2 (D) mRNA levels by RT-qPCR protein levels by western blot (WB) (E) in non-cancerous p69, cancerous LNCaP and C4–2 human prostate cells grown in serum-fed conditions. Band intensities were quantified by ImageJ software, and the data were normalized to β-Actin (loading control) and presented as fold (f) change relative to that of p69. Data are (± S.E.) from multiple experiments.

An official website of the United States government
Here's how you know
Official websites use .gov
A
.gov website belongs to an official
government organization in the United States.
Secure .gov websites use HTTPS
A lock (
) or https:// means you've safely
connected to the .gov website. Share sensitive
information only on official, secure websites.
