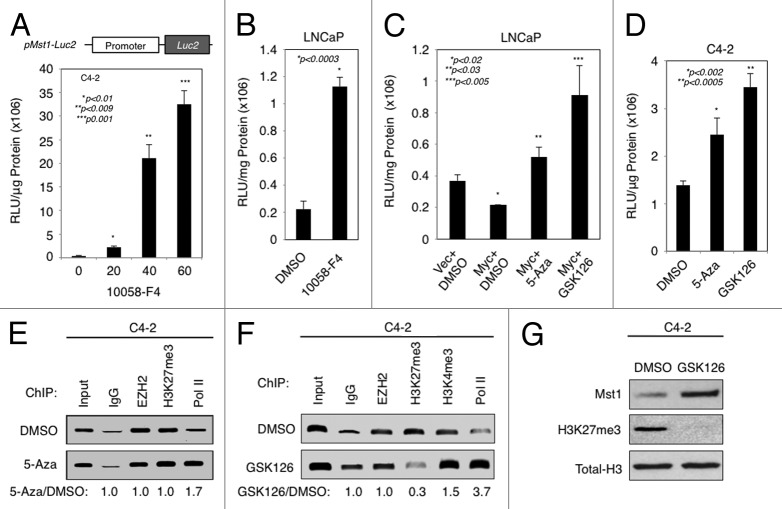
Figure 5. EZH2-mediated chromatin remodeling and DNA methylation attenuates MST1 promoter activation and expression. (A) MST1 promoter luciferase reporter activity in C4–2 cells after transient transfection with pMST1-Luc2 reporter or mock vector, followed by treatment with increasing doses (0, 20, 40, 60 µM) of 10058-F4 for 48h. Relative luciferase units (RLUs) were normalized to total protein and then normalized to the RLU of vector control. (B) Activity of MST1 promoter luciferase reporter in LNCaP cells transiently transfected with pMST1-Luc2 reporter or mock vector construct and then treated with DMSO (vehicle) or 60 µM 10058-F4 in serum-fed conditions. Luciferase assay was performed at 48h post treatment. (C) MST1 promoter luciferase reporter activity in LNCaP cells transiently co-transfected with pMST1-Luc2 reporter with mock (vector) or MYC expression construct and then treated with DMSO (vehicle), 5 µM 5-Aza, or 2 µM GSK126. Luciferase assay was performed at 48h post-transfection. (D) MST1 promoter luciferase reporter activity in C4–2 cells that were transiently transfected with pMST1-Luc2 reporter or mock vector construct and then treated with DMSO (vehicle), 5 µM 5-Aza, or 2 µM GSK126. Luciferase assay was performed at 48h post treatment. (E and F) Chromatin immunoprecipitation (ChIP) analysis of the EZH2, H3K27me3, H3K4me3, RNAP II and IgG (control) enrichment on MST1 promoter. C4-2 cells were treated with DMSO (vehicle), 5 µM 5-Aza or 2 µM GSK126 in serum-fed conditions at 48h. Bound DNA was analyzed by PCR. Band intensities quantified by ImageJ are presented as fold change relative to DMSO. (G) Levels of total MST1, H3K27me3 or H3 protein in C4-2 cells that were treated with DMSO or 2 µM GSK126. Western blot was performed using antibodies to corresponding proteins at 48h post-treatment. Data (± S.E.) are representative of three independent experiments.

An official website of the United States government
Here's how you know
Official websites use .gov
A
.gov website belongs to an official
government organization in the United States.
Secure .gov websites use HTTPS
A lock (
) or https:// means you've safely
connected to the .gov website. Share sensitive
information only on official, secure websites.
