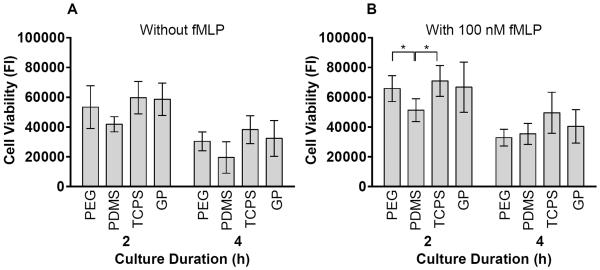
Figure 2.
Cell viability in PMN cultures A) without fMLP and B) with 100 nM fMLP on PEG hydrogels, PDMS, TCPS and GP hydrogels at 2 and 4 hours as measured by fluorescent intensity (FI) of cell metabolic capacity using CellTiter-Blue® Reagent. Results represent the mean ± standard deviation, n = 4. *: significant difference between materials, p = 0.01–0.05.

