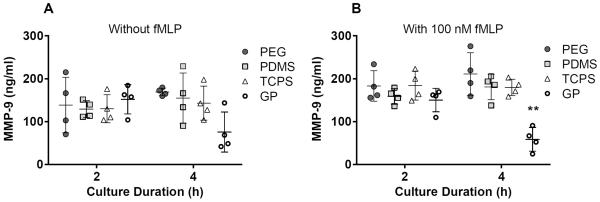
Figure 4.

MMP-9 concentrations in supernatants from PMN cultures on PEG hydrogels, PDMS, TCPS and GP hydrogels at 2 and 4 hours. Results represent the mean ± standard deviation with each data point representing a different donor, n = 4. **: significant difference from PEG hydrogel, PDMS and TCPS at the same time point, p = 0.0001–0.01.
