Figure 1.
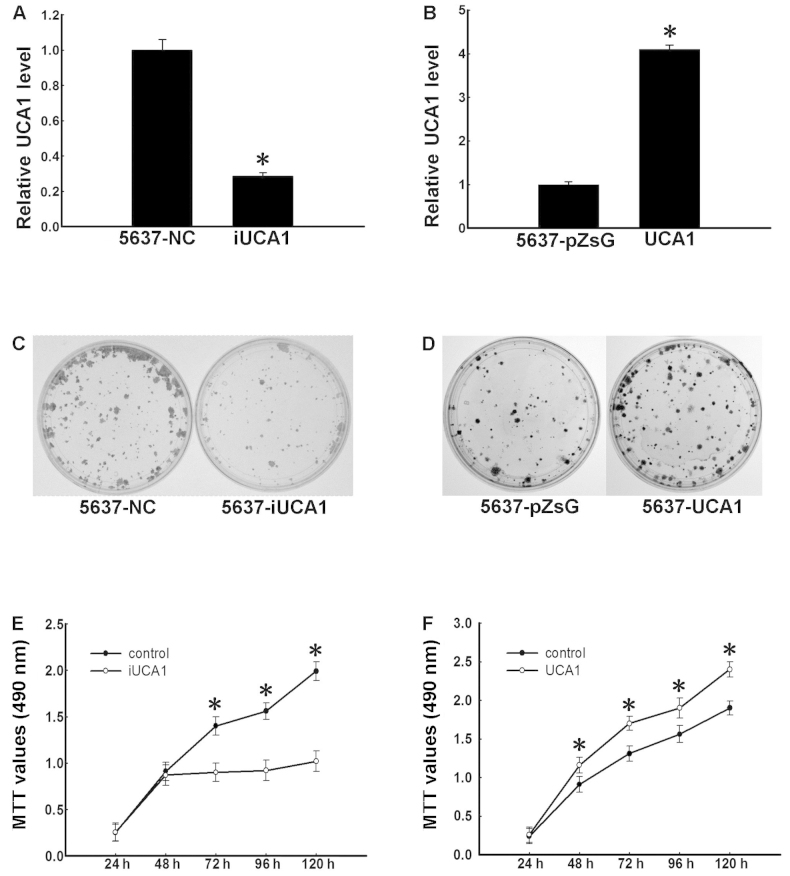
UCA1 promotes proliferation of 5637 cells. (A) Establishment of UCA1 knockdown 5637 cells. The 5637 cells were infected with pll3.7-NC (control) and pll3.7-iUCA1 viruses and selected with G418 for a week to generate 5637-NC and 5637-iUCA1 cells, respectively. Total RNA was isolated and the level of UCA1 was determined using real-time PCR. Data were normalized to GAPDH and expressed as the means ± SD of three independent experiments. *P<0.05 (t-test). (B) Establishment of UCA1 overexpressing 5637 cells. The 5637 cells were infected with pZsG or pZsG-UCA1 viruses and selected with puromycin for 7 days to generate 5637-pZsG and 5637-UCA1 cells, respectively. Total RNA was isolated and the level of UCA1 was determined using real-time PCR. Data are expressed as the means ± SD of three independent experiments. *P<0.05 (t-test). (C) Colony formation of 5637-NC and 5637-iUCA1 cells. The cells were cultured for 14 days. Colonies were stained using crystal violet. (D) Colony formation of 5637-pZsG and 5637-UCA1 cells. The cells were cultured for 14 days. Colonies were stained using crystal violet. (E) Growth curve of 5637-iUCA1 cells. Cellular proliferation was measured using MTT assays at 24, 48, 72, 96 and 120 h. The differences in data of 72, 96 and 120 h were significant, *P<0.05 (t-test). (F) Growth curves of 5637-UCA1 cells. Cellular proliferation was measured using MTT assays at 24, 48, 72, 96 and 120 h. The differences in data of 48, 72, 96 and 120 h were significant, *P<0.05 (t-test). UCA1, urothelial carcinoma associated 1.

