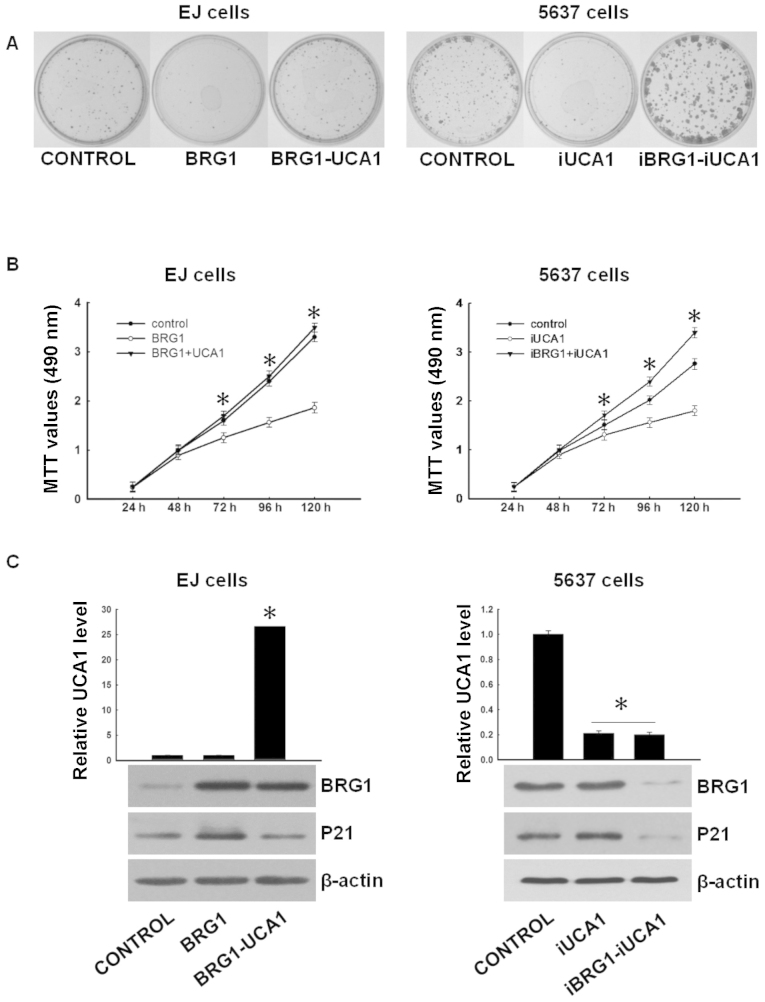
Figure 4.
UCA1 antagonizes the tumor suppressing function of BRG1. (A) (Left) Colony formation of EJ control, EJ-BRG1 (overexpressed BRG1) and EJ-BRG1-UCA1 (overexpressed BRG1 and UCA1) cells. The cells were cultured with G418 for 10 days. Colonies were stained using crystal violet. (Right) Colony formation of 5637 control, 5637-iUCA1 (UCA1 knocked down) and 5637-iUCA1-iBRG1 (UCA1 and BRG1 both knocked down) cells. The cells were cultured with G418 and puromycin for 10 days. Colonies were stained using crystal violet. (B) (Left) Growth curves of EJ control, EJ-BRG1 and EJ-BRG1-UCA1 cells. Cellular proliferation was measured using MTT assays at 24, 48, 72, 96 and 120 h. The differences between EJ-BRG1 and EJ-BRG1-UCA1 were significant. *P<0.05 (t-test). (Right) Growth curves of 5637 control, 5637-iUCA1 and 5637-iUCA1-iBRG1 cells. Cellular proliferation was measured using MTT assays at 24, 48, 72, 96 and 120 h. The differences between 5637-iUCA1 and 5637-iUCA1-iBRG1, 5637-iUCA1 and control were significant *P<0.05 (t-test). (C) (Left) The expression levels of UCA1 in EJ cells control EJ-BRG1 and EJ-BRG1-UCA1 were determined by real-time PCR. Data were normalized to GAPDH and are expressed as the means ± SD of three independent experiments, the UCA1 level in EJ-BRG1-UCA1 was significantly high, *P<0.05 (t-test). The expression levels of BRG1 and p21 were determined by western blotting with β-actin as the internal control. (Right) The expression levels of UCA1 in 5637 cells control 5637-iUCA1 and 5637-iUCA1-iBRG1 were determined by real-time PCR. Data were normalized to GAPDH and are expressed as the means ± SD of three independent experiments. The effect of RNAi was significant *P<0.05 (t-test). The expression levels of BRG1 and p21 were determined by western blotting with β-actin as the internal control. UCA1, urothelial carcinoma associated 1.

