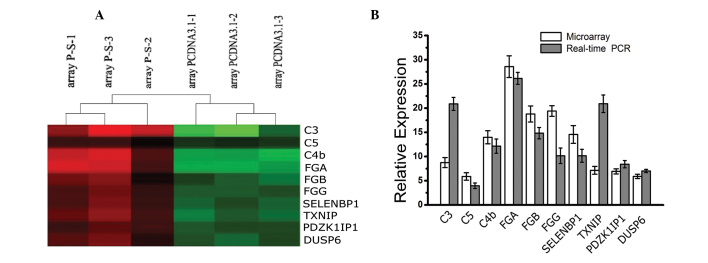
Figure 3.

Differentially expressed genes between A549-P-S and A549-P cells by microarray assay and qPCR validation. (A) Each group in triplicate was shown on the same chip. Color intensity was assigned to ratios of gene expression; shades of red indicate genes that were upregulated; shades of green indicate genes that were downregulated. (B) 10 upregulated genes were identified by qPCR, which was consistent with cDNA microarray data. qPCR, quantitative polymerase chain reaction; C3, complement C3 precursor; C4b, complement 4B preproprotein; FGA, fibrinogen α chain precursor; FGB, fibrinogen β chain precursor; FGG, fibrinogen γ chain precursor; SELENBP1, selenium binding protein 1; TXNIP, thioredoxin-interacting protein; PDZK1IP1, PDZK-interacting protein 1; DUSP6, dual specificity protein phosphatase 6.
