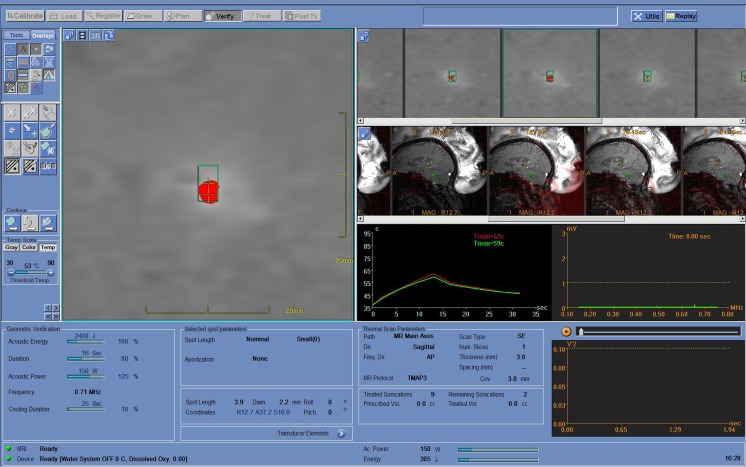
Fig. 2.
Representative screen shot from the planning station during a magnetic resonance-guided focused ultrasound treatment. On the left is a thermographic map indicating the target volume and shape as it is heated (shown in red). In the middle of the figure (red and green lines) is a temperature time curve displaying a single sonication of just over 30 s duration. During this sonication it took approximately 13 s to reach the maximal temperature of 59 ºC. The serial sagittal images of the brain allow the treating surgeon to view in real-time the location and development of the lesion

