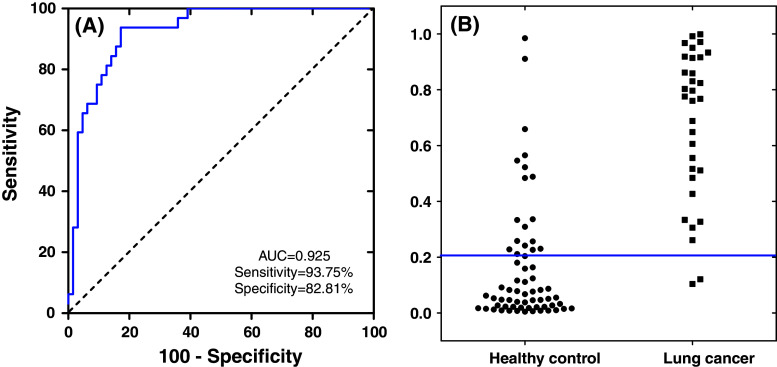
Fig. 3.
ROC curve and interactive dot diagram for the logistic regression model. a Logistic regression model using five biomarkers (CCNI, FGF19, FRS2, GREB1, and EGFR) in the pre-validation sample set results in AUC value of 0.925 with 93.75 % sensitivity and 82.81 % specificity (cut-off, 0.2598). b Interactive dot diagram based on the qPCR data of the lung cancer group (n = 32) and healthy control group (n = 64)

