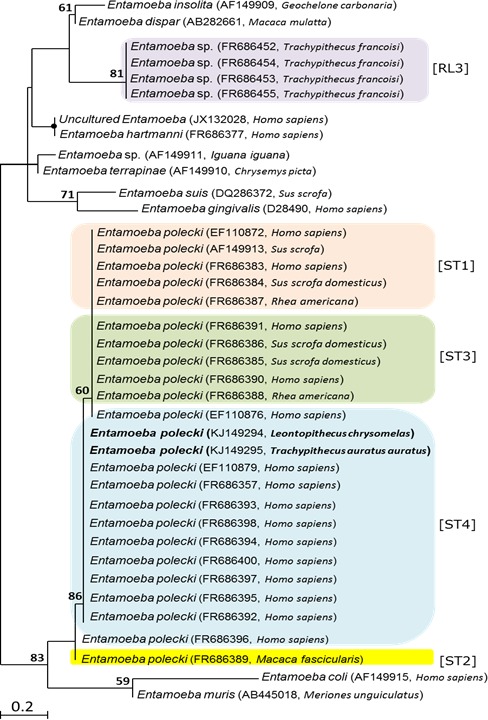
Figure 2. Phylogenetic tree based on partial 18SrDNA sequences, showing the relationships among Entamoeba species.

Phylogenetic analysis used two different approaches, distance-based analysis and maximum-likelihood (ML), produced trees with identical topologies of which only ML tree is presented. GenBank accession numbers and host species are given in parentheses after the taxon name. Sequences in bold face were obtained during this study. Numbers above branches are bootstrap values (%) from 1,000 replicates. Nodes of the tree with bootstrap values of ≥95% are indicated by black closed circles. The node is not labeled where bootstrap support values is <50. Bar = estimated number of substitutions per site.
