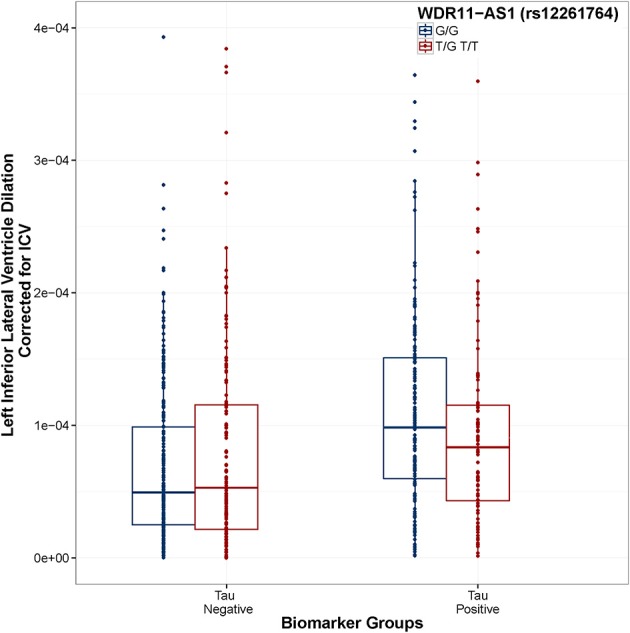
Figure 4.

WDR11-AS1 (rs12261764) modifies the association between Tau positivity and ventricular dilation. Biomarker groups are presented on the x-axis and annual change in the left inferior lateral ventricle is presented on the y-axis. Boxplots are grouped by rs12261764. G is the minor allele. When controlling for Age, Gender, Education, Diagnosis, and ICV, the tau_positive × rs12261764 interaction was statistically significant (t = 5.55, p = 4.06 × 10⁻⁸). In the tau positive biomarker group, homozygous carriers of the G allele showed a greater rate of ventricular dilation than carriers of the T allele (t = 2.18, p = 0.030). In the tau negative biomarker group, homozygous carriers of the G allele showed a slower rate of ventricular dilation than carriers of the T allele (t = 2.21, p = 0.027). Model: LILV Slope = β0 + β1Baseline_Age + β2 Baseline_ICV + β3 Gender + β4 Education + β5Dx + β6Tau_Positive + β7Amyloid_Positive + β8SNP + β9SNP*Amyloid_Positive + β10SNP*Tau_Positive.
