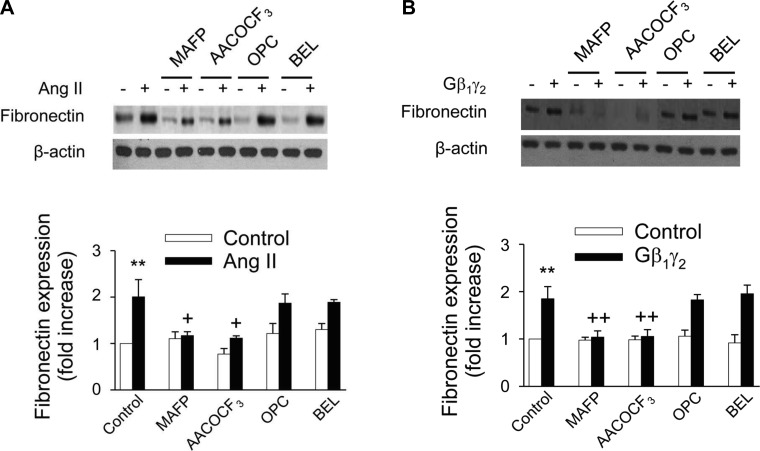
Fig. 13.
Blocking cPLA2 but not Ca2+-independent (i) PLA2 or secretory (s) PLA2 reversed the effects of ANG II and Gβ1γ2 on fibronectin expression. Renal proximal tubular cells were treated with 10 μmol/l AACOCF3, MAFP, OPC, or BEL for 15 min or the vehicle DMSO, then stimulated with ANG II (1 μmol/l; A) or transfected with plasmid encoding β1 and γ2 (5 μg each) or empty vector (mock, 10 μg; B) for 48 h. At the end of incubation, cell lysates were fractionated on SDS-PAGE, and fibronectin protein expression was assessed by direct immunoblotting of cell lysates (top). Actin was included as a control for loading and the specificity of change in protein expression. A representative blot from 6 independent experiments is shown. Bar graph at the bottom represents the ratio of the intensity of the fibronectin band quantified by densitometry factored by the densitometric measurements of the actin band. Values are means ± SE from 6 independent experiments. **P < 0.001 vs. control. ++P < 0.001, +P < 0.05 vs. ANG II- or Gβ1γ2-treated cells.

