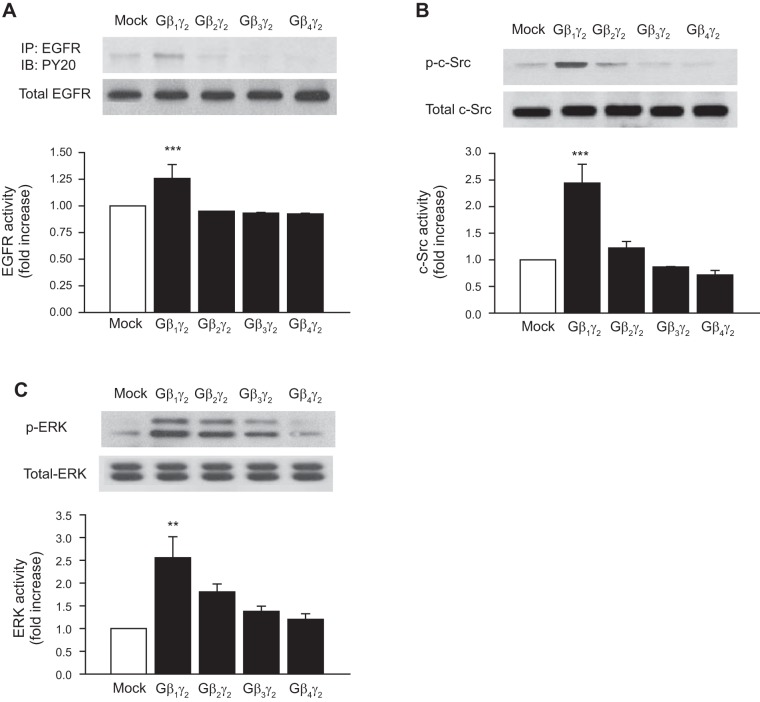
Fig. 3.
Effect of different Gβγ combinations on EGFR, c-Src, and ERK activity. Rabbit proximal tubule cells were transiently transfected without (mock) or with 10 μg of the expression plasmids for Gβ1, Gβ2, Gβ3, Gβ4, or Gγ2. Equal amounts of cell lysates (30 μg) were resolved by SDS-PAGE followed by Western blotting with anti-EGFR, anti-phospho-c-Src (Tyr416), and anti-phospho-p42MAPK (Try202)/p44MAPK (Try204) (ERK1/2), and p42MAPK (Try202)/p44MAPK (Try204) antibodies. Equal protein loading was confirmed by membrane reprobing with anti-EGFR, anti-c-Src, or anti-ERK antibodies. The corresponding bands were scanned, and intensities were normalized to anti-EGFR, anti-c-Src, and anti-ERK from the same tubular cell protein extract. One representative Western blot is shown for every experiment. A: phosphorylation of EGFR (top) compared with total expression of EGFR (bottom). B: phosphorylation of c-Src (p-c-Src; top) compared with total expression of c-Src (bottom). C: phosphorylation of ERK (p-ERK; top) compared with total expression of ERK (bottom). Bar graphs depict the quantitative densitometry analysis for Western blot densitometry data. Values are means ± SE of 4 independent experiments. ***P < 0.001, **P < 0.01 for comparison with control.

