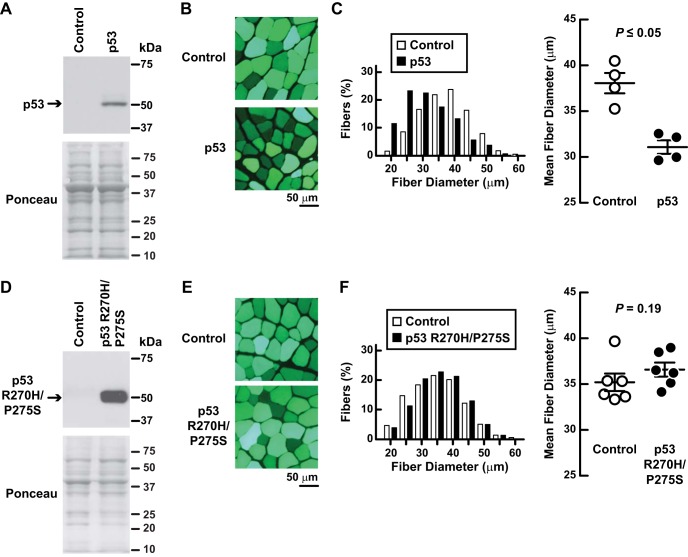
Fig. 2.
Increased p53 expression causes skeletal muscle fiber atrophy. A–C: in C57BL/6 mice, 1 TA muscle was transfected with 20 μg of p-wt-p53 plus 2 μg of p-eGFP, and the contralateral TA (“control”) was transfected with 20 μg of empty plasmid (pcDNA3) plus 2 μg of p-eGFP (enhanced green fluorescent protein). eGFP served as a transfection marker and did not alter muscle fiber size (18). Bilateral TAs were harvested 7 days posttransfection for further analysis. A: an equal amount of protein from each muscle (100 μg) was subjected to SDS-PAGE and immunoblot analysis with anti-p53 polyclonal IgG. Membranes were stained with Ponceau S to confirm equal loading. B and C: histological analysis of muscles. Representative images (B) and quantification of muscle fiber size (C). C, left: fiber size distributions; each distribution represents ≥1,600 fibers from 4 muscles. C, right: mean fiber diameters; each data point represents the mean diameter of ≥400 fibers from 1 muscle. Horizontal bars denote means ± SE. P value was determined with a paired t-test. D–F: in C57BL/6 mice, 1 TA muscle was transfected with 20 μg of p-mut-p53 plus 2 μg p-eGFP, and the the contralateral TA (control) was transfected with 20 μg of empty plasmid (pcDNA3) plus 2 μg p-eGFP. Bilateral TAs were harvested 7 days posttransfection for further analysis. D: an equal amount of protein from each muscle (50 μg) was subjected to SDS-PAGE and immunoblot analysis with anti-p53 polyclonal IgG. Membranes were stained with Ponceau S to confirm equal loading. E and F: histological analysis of muscles. Representative images (E) and quantification of muscle fiber size (F). F, left: fiber size distributions; each distribution represents ≥2,300 fibers from 6 muscles. F, right: mean fiber diameters; each data point represents the mean diameter of ≥450 fibers from 1 muscle. Horizontal bars denote means ± SE. P value was determined with a paired t-test.

