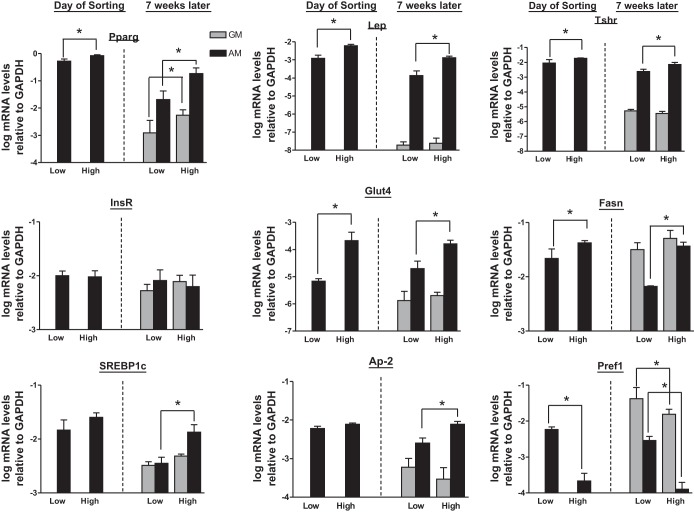
Fig. 2.
Redifferentiated WAT cells with High BODIPY staining express higher levels of Pparγ, Leptin (Lep), and Tshr mRNAs than cells with Low BODIPY. These mRNA expression patterns are heritable over numerous passages. Left 2 bars: mRNA levels of Pparγ, Lep, Tshr, InsR, Glut4, Fasn, Srebp1c, aP2, and Pref1 in primary WAT from the original Low and High BODIPY populations (day of sorting); values are means ± SD of 3 separate experiments from WAT from 3 mice. All 3 mRNA levels were higher in lysates of cells from high- vs. low-BODIPY populations (*P < 0.05). Right 4 bars: mRNA levels in low- and high-BODIPY cells cultured in GM for 7 wk or cultured for 6 wk in GM and then redifferentiated with the adipogenic protocol (AM) described in materials and methods. Values are means ± SD of 3–6 cell populations from tissues extracted from 3 mice (*P < 0.05).

