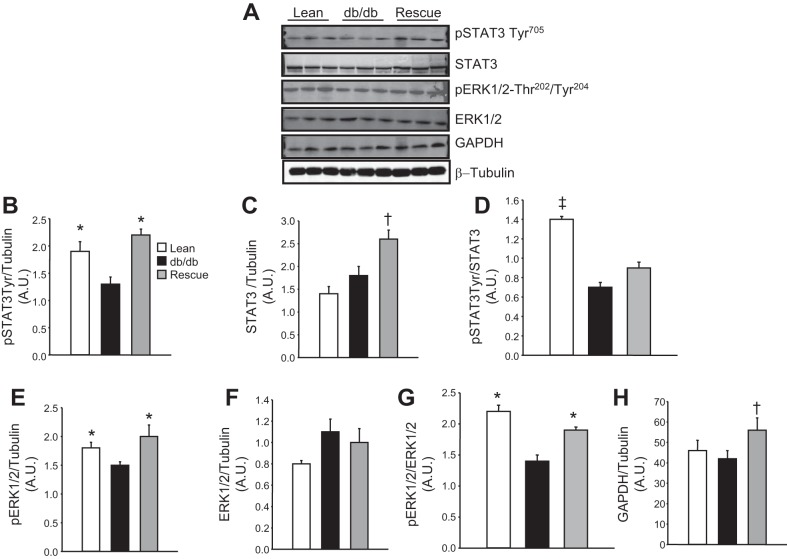
Fig. 6.
A: representative Western blots in lean, db/db, and db/db-cardiac LepR rescue mice. B: levels of p-STAT3-Tyr. C: levels of STAT3. D: levels of p-STAT3 normalized to total STAT3. E: levels of p-ERK1/2. F: levels of ERK. G: levels of p-ERK1/2 normalized to total ERK. H: levels of GAPDH. *P < 0.05 compared with db/db mice; †P < 0.05 compared with lean and db/db mice; n = 3. ‡P < 0.05 compared with db/db and rescue mice. AU, arbitrary units.

