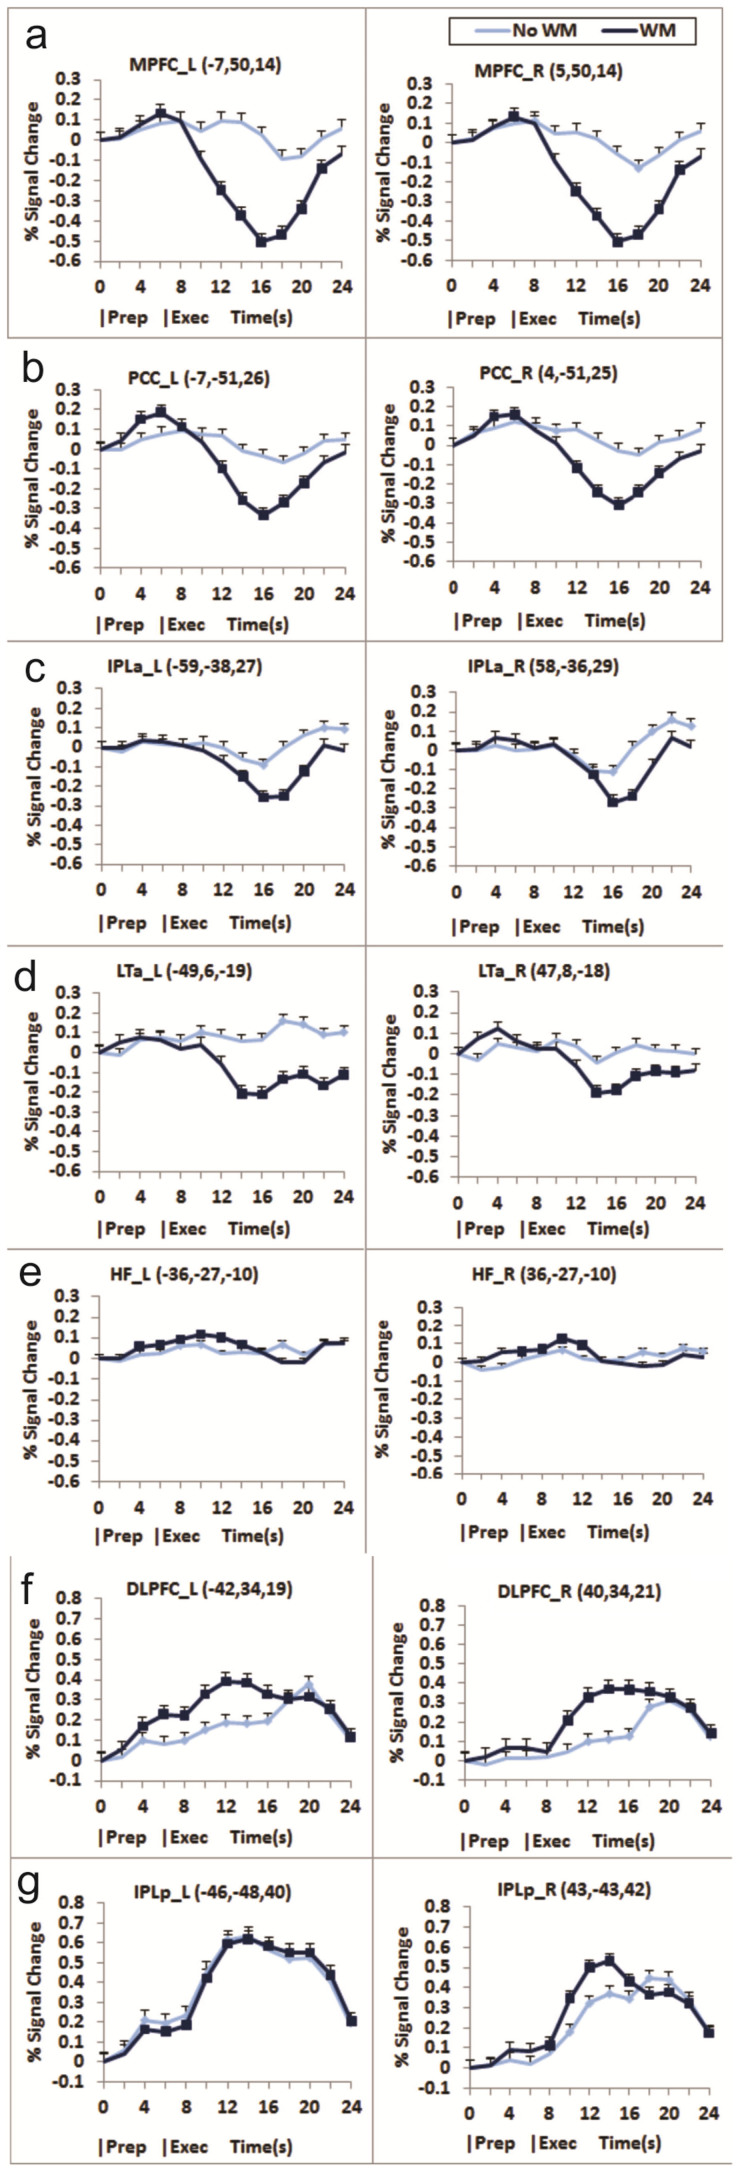
Figure 3. Signal change (%) of the DMN and WMN regions across the time course with the stimulus onset as a baseline.
(a) anterior medial prefrontal cortex (MPFC), (b) posterior cingulate (PCC), (c) anterior IPL (IPLa), (d) lateral temporal (LT), and (e) hippocampal formation (HF). All WMN regions showed activation for the DUAL condition during the execution period. (f) dorsolateral prefrontal cortex (DLPFC), and (g) posterior IPL (IPLp). The central coordinates for each ROI is shown inside the parentheses. Error bars denote the standard error of the mean. The 99% confidence interval was computed with the following formula. .99CI = Mean psc + critical t value × standard error, in which the standard error was computed by the square root of the Mean Square Error/N. The mean square error was taken from the ANOVA. The large data points indicate the points that the 99% confidence interval did not include zero. The small data points indicate those points that the 99% confidence interval included zero.

