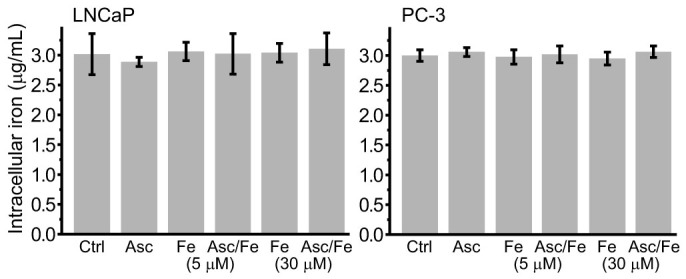
Figure 4. Intracellular iron in LNCaP and PC-3 cells.

Cells were exposed to Asc (5 mM) and/or Fe (5 or 30 μM). The results are normalized to 1 × 10⁶ cells/mL. Statistical analysis was performed using one-way ANOVA with post hoc Duncan test. There was no significant difference (p < 0.05) in concentration between any of the treatments.
