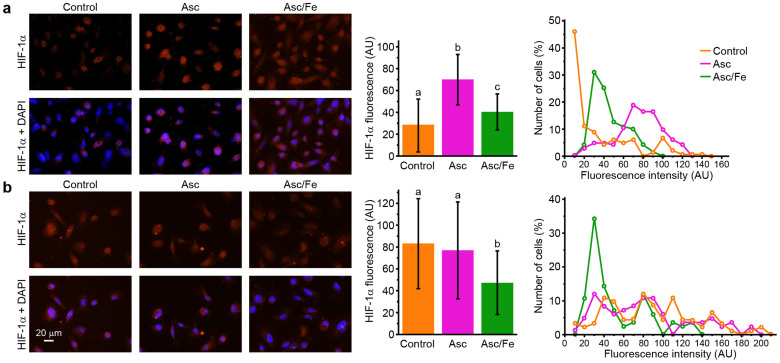
Figure 5. The level of HIF-1α in cancer cells exposed to Asc (5 mM) and Fe (5 μM).
(a) LNCaP. (b) PC-3. Micrographs showing HIF-1α immunofluorescence and HIF-1α merged with DAPI staining of nuclei, average per-pixel intensities of HIF-1α immunofluorescence (bars not sharing a common letter are significantly different and percentage distribution of cells according to average per-pixel intensities of fluorescence are presented (the number of cells (%) was bracketed to 10 AU steps). Cells were stained 2 h after the treatment. Statistical analysis was performed using one-way ANOVA with post hoc Duncan test. All statistical differences were at the 0.001 level.

