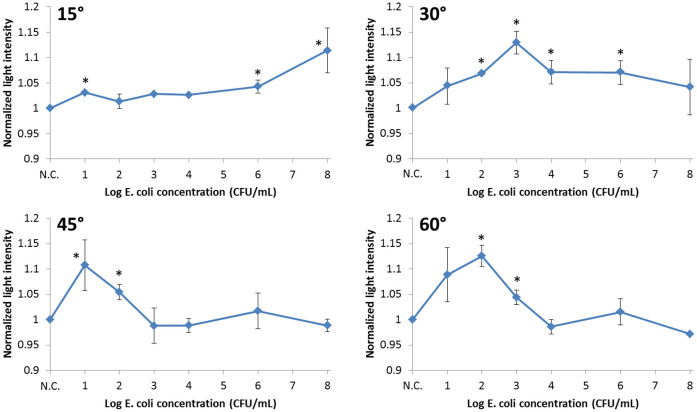
Figure 3. Normalized scatter light intensities plotted against the log concentrations of E. coli on ground beef.
Error bars represent standard errors. The scatter detection angle was 15°, 30°, 45° and 60°. Each data point represents the mean of three replicates (each measured from different locations on a ground beef sample). A new ground beef sample was used for each E. coli concentration. Stars (*) represent the data points that are significantly different from the negative control, with p < 0.05 (two-sample t-tests).

