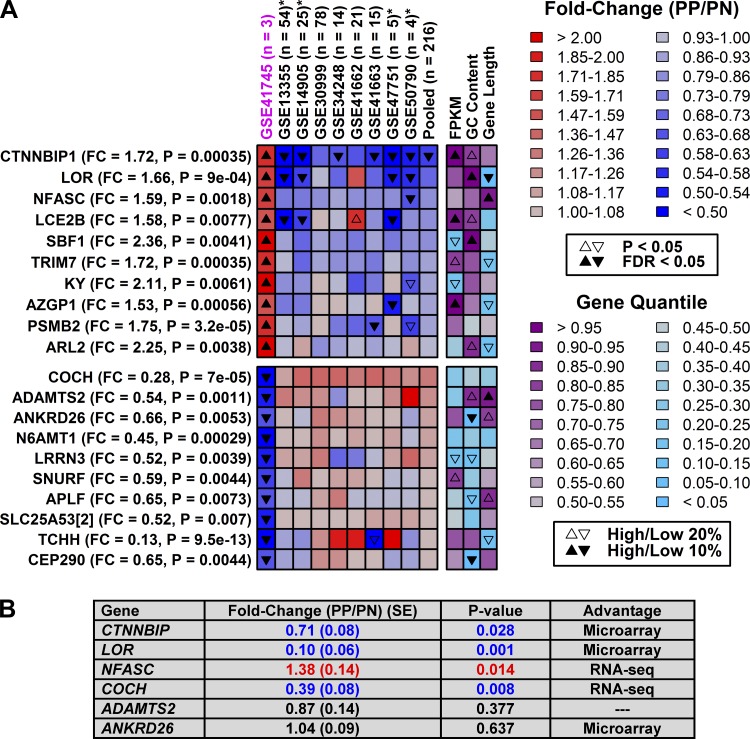
Fig. 7.
Genes uniquely identified as differentially expressed by RNA-seq. A, top: genes significantly elevated in psoriasis lesions according to RNA-seq (GSE41745) but decreased in microarray studies (pooled data, n = 216 patients). Bottom: genes significantly decreased in psoriasis lesions according to RNA-seq but increased in microarray studies. Genes are listed in the left margin along with FC (PP/PN) and FDR values (RNA-seq). Final heat-map columns indicate percentile rankings of genes with respect to their mean expression in PP and PN samples (FPKM), GC content, and length. B: RT-PCR analysis of 6 genes based upon independent samples (n = 8 patients).

