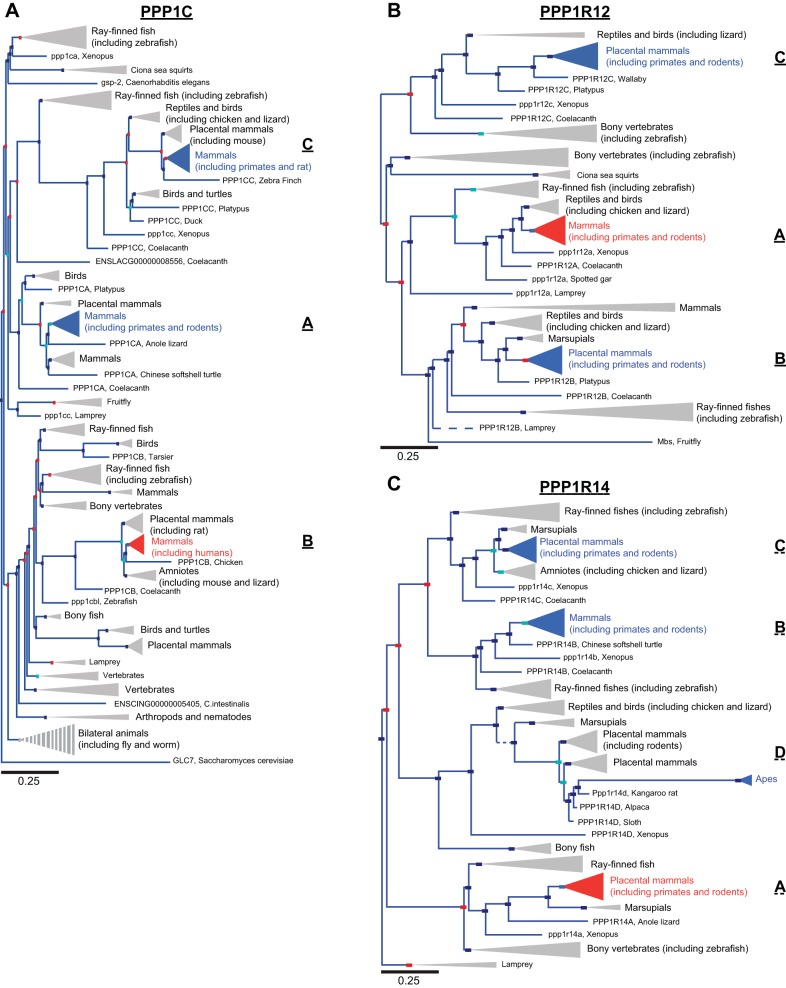
Fig. 1.
Phylogenetic trees of myosin phosphatase subunit families. A: phylogenetic tree of the protein phosphatase 1 (PP1) catalytic subunit family demonstrates high conservation amongst orthologs and paralogs. The node containing the human myosin phosphatase (MP) catalytic subunit, PPP1CB (PP1β), is shown in red, whereas paralogs PPP1CA (PP1α) and PPP1CC (PP1γ) are in blue. B: phylogenetic tree of the MP targeting subunit family is given with the node containing the human smooth muscle MP subunit, protein phosphatase 1 regulatory subunit 12A (PPP1R12A) (MP targeting subunit 1; Mypt1) shown in red and paralogs PPP1R12B (Mypt2) and PPP1R12C (myosin binding subunit 85; MBS85) shown in blue. C: phylogenetic tree of the MP inhibitory subunit family (PP1 regulatory subunit 14; PPP1R14) demonstrates greater variability between paralogs and orthologs compared with the catalytic subunit in A. The node containing the human MP inhibitory subunit PPP1R14A (c-kinase potentiated protein phosphatase 1 inhibitor 17; CPI-17) is shown in red, whereas the paralogs PPP1R14B (phosphatase holoenzyme inhibitor; PHI), PPP1R14C (kinase enhanced phosphatase inhibitor; KEPI), and PPP1R14D (gastric brain phosphatase inhibitor; GBPI) are shown in blue. In the trees the red boxes represents gene duplication and the dark blue boxes speciation events. Light blue boxes are ambiguous nodes. Branch lengths along the horizontal axis correspond to the expected number of changes per nucleotide site in the DNA, as indicated in the corresponding scale bars, which is proportional to evolutionary divergence. The length (horizontal) of solid branches and nodes (triangles) is 1× distance, whereas dashed branches and striped nodes are 10× distance. The width (vertical) of nodes is proportional to the number of orthologs included in the node. Phylogenetic trees were developed by Ensembl, Release 75 (February 2014) (105).

