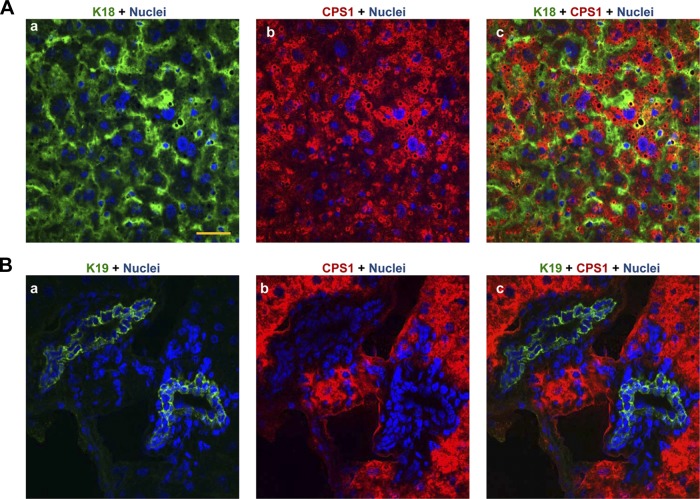
Fig. 3.
Hepatocyte-selective CPS1 expression in the liver. A: liver sections from normal mice were fixed in methanol (−20°C, 10 min) then stained with antibodies to CPS1 (red) and keratin 18 (green) followed by DAPI (blue, nuclei). B: duplicate slides to those used in A were stained with antibodies to CPS1 (red) and keratin 19 (green). Note that ductal cells exclude CPS1 staining (merged, C). Scale = 50 μm. All images are representative of similar images obtained from 3 separate livers.

