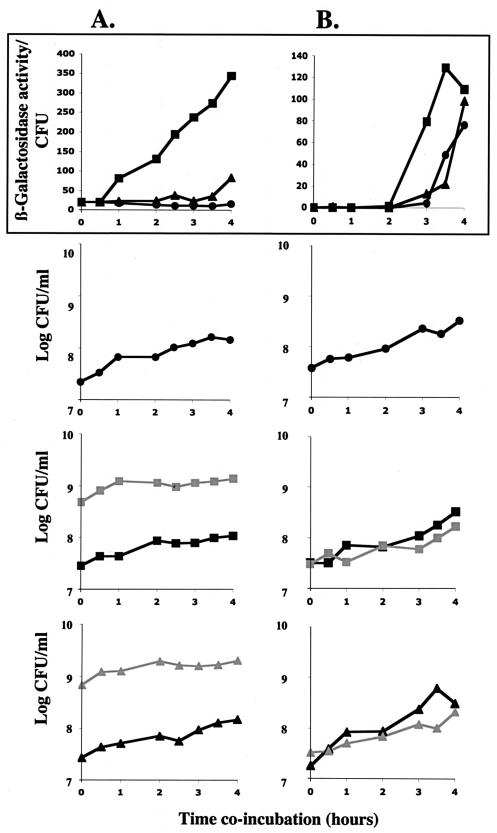
FIG. 7.
The ability of B. cepacia K56-2 or K56pvdA::tp to induce fusion I in mixed cultures was determined under different conditions. (A) Burkholderia cells were in the majority and in stationary phase (added at an OD600 of roughly 1.0 to fusion I cells at an OD600 of 0.1). (B) There were equal numbers of Burkholderia cells and fusion I cells and Burkholderia cells were in early logarithmic growth (added at an OD600 of 0.1 to fusion I cells at an OD600 of 0.1). The top panels indicate the expression levels of fusion I cells incubated alone (black circles), with B. cepacia K56-2 (black squares), or with K56pvdA::tp (black triangles). The lower three sets of panels show growth (log CFU/ml) of the strains in the different mixed cultures; fusion I cells (black circles, black squares, and black triangles) are in culture alone, with B. cepacia K56-2 (gray squares), or with B. cepacia K56pvdA::tp (gray triangles). The experiments shown are representative of the results obtained; the experiments were repeated four times.

