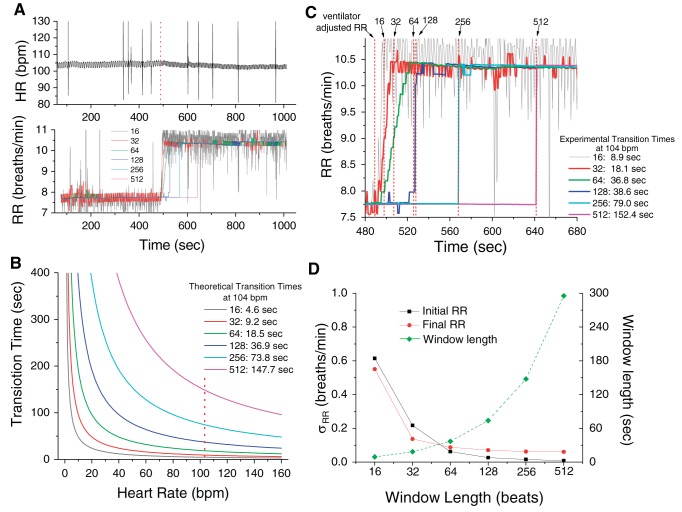
Fig. 1.
Selection of the optimal beat window. A: respiratory rate (RR) and heart rate (HR) are plotted as a function time (note a change of the ventilator rate at 489 s); the RR is estimated using a 16 (gray line)-, 32 (red line)-, 64 (green line)-, 128 (dark blue line)-, 256 (light blue line)-, and 512 (pink line)-beat window. Dotted line indicates the timing of the change in the ventilator rate. B: theoretical estimation of the transition time required for each of the 16-, 32-, 64-, 128-, 256-, and 512-beat window to reach a new rate (window length in beats × 60/HR in beats/min/2). Given that at 489 s the instantaneous HR was 104 beats/min, the theoretical transition times were 4.6, 9.2, 18.5, 36.9, 73.8, and 147.7 s, respectively. Dotted line indicates the 104 beats/min. C: average (across leads) RR plotted as a function of time; the data were fitted with the Boltzmann equation (y = A2 + (A1 − A2)/{1 + exp[(x − xo)/dx]}) to obtain the experimental transition times presented in the same panel and indicated by the dotted lines. D: SD of initial (black square) and final (red circle) RR estimates of A, using a 16-, 32-, 64-, 128-, 256-, and 512-beat window (left axis). The window length in beats (green diamond) is also plotted (right axis); bpm, beats/min.

