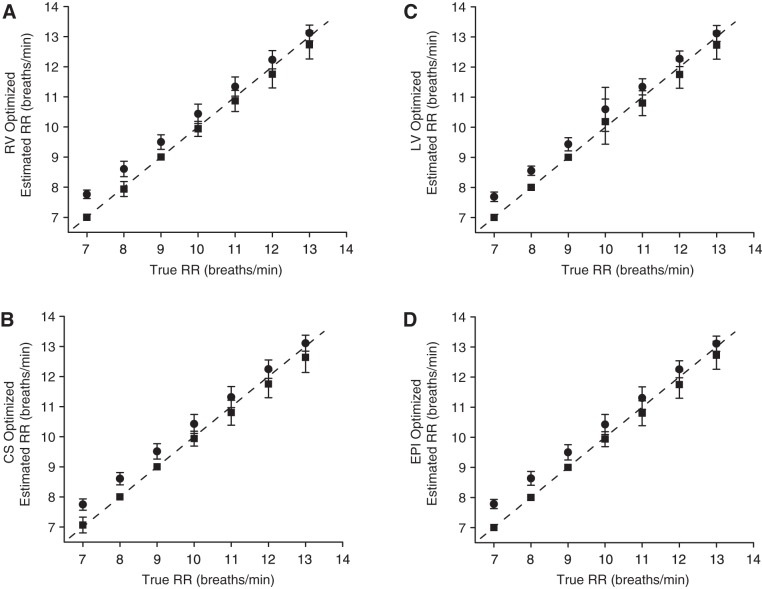
Fig. 6.
Estimated vs. true respiration rate using the optimized algorithm, compiled across all animals and tidal volumes, for RV (A), CS (B), LV (C), and EPI (D) lead groupings. Nonrounded estimates (●) and downrounded rounded estimates (■) are displayed as means ± SD. A dashed line marks equality (y = x). The downrounded respiration estimates closely track the true RR, with goodness-of-fit R2 statistic of 0.97, 0.96, 0.96, 0.97, and 0.96 for RV, CS, LV, EPI, and RV-CS estimates, respectively (RV-CS data not shown).

